
- Sui (SUI) is forming a head-and-shoulders pattern with $3.02 acting as a crucial neckline that may determine future price action.
- Technical indicators like stochastic RSI and BBP reflect bearish momentum where traders seek to break through at major support levels.
- If $3.02 holds, SUI could rally to $3.80 or higher, but failure to sustain at support could push price to $1.69.
Sui (SUI) has formed a head-and-shoulders (H&S) pattern on charts that typically signals a reversal of trend. If that is so, it would go to $1.69. At press time SUI was at $3.39 , representing 2.07% decline in the past 24 hours but has stayed at a gain of 9.01% for the last 7 days.
Crypto analyst Ali (@ali_charts) commented on Twitter that SUI is in the formation of an H&S pattern. There is a left shoulder (the initial December 2024 rally), a head (the mid-January 2025 high), and a right shoulder (the early February 2025 lower high). $3.02 has been employed as the neckline that has served as support. If SUI penetrates through that level, it may experience a sharp downtrend.
The measured move from the head to the neckline suggests that the target would be approximately $1.69 in accordance with a level of importance of support. Traders monitor this pattern to determine where the next price movement would lead us to.
Technical Indicators Support Bearish Outlook
The stochastic RSI is in overbuy at %K at 85.30 and at %D at 89.36. Downward movement might gain strength if there is a bearish crossover.
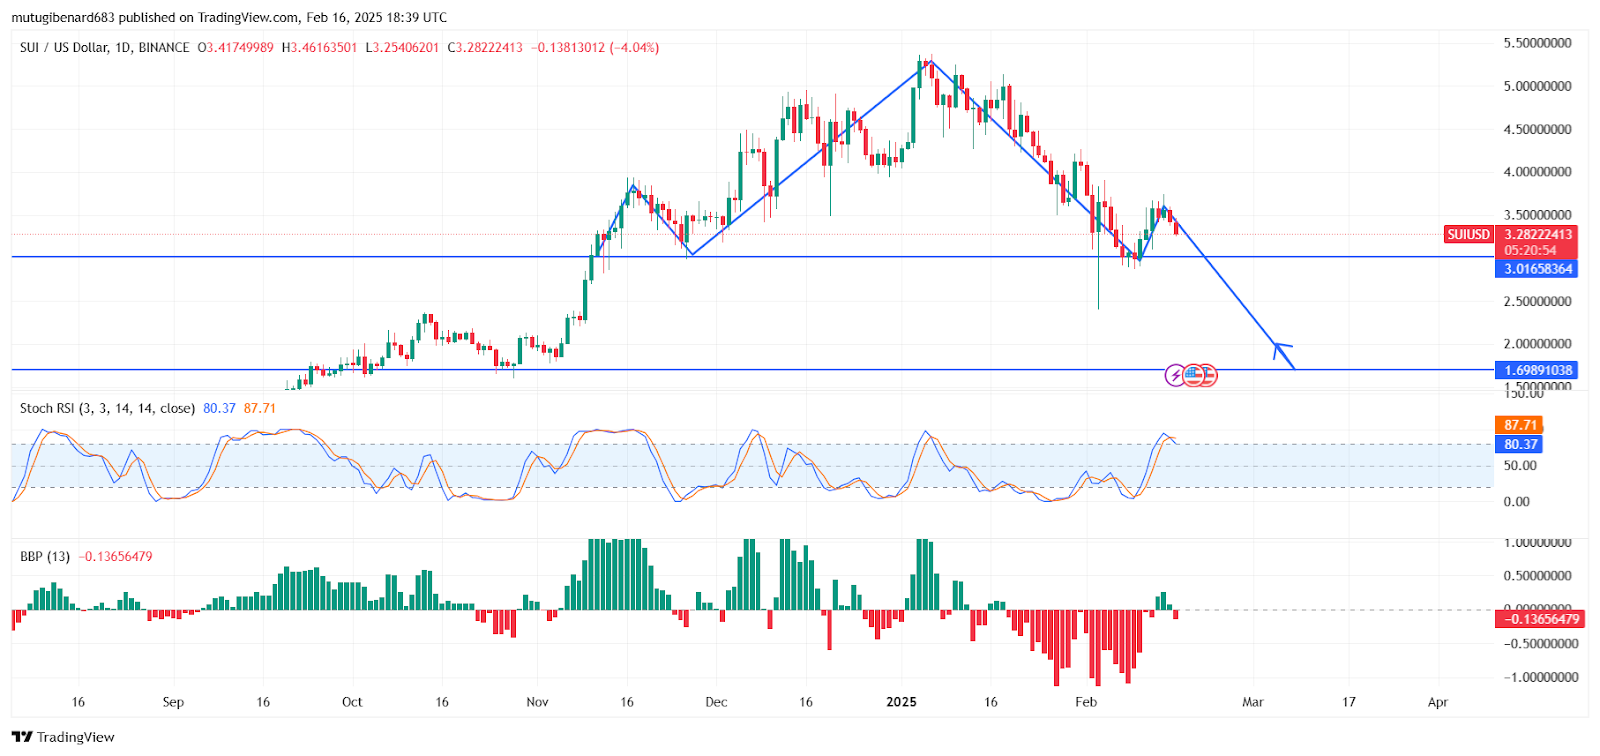
Bull and Bear Power (BBP) indicator is negative at -0.078, which would mean that the sellers have dominance. Continued negative histogram would further solidify bearish pressure.
If 3.02 support level is violated on good selling volume, that would create a bearish breakdown.
Potential Price Scenarios for SUI
If the $3.02 neckline holds, a reversal to $3.80–$4.00 is likely. Bulls must break through $3.80 to erase the bearish pattern. Alternatively, if support gives way, SUI can drop to $1.69, with intermediate support at $2.50.
For bearish traders, it is recommended to enter on confirmed breakdown at $3.02 with target $2.50. Bullish traders may look for confirmation of turn around $3.02 to target $3.80 or more.
Market participants would keenly watch price movement and volume in future trades to determine if the H&S pattern would lead to breakdown to bears or if support would hold for recovery.