
- SUI has undergone a strong retest, with technical indicators pointing toward a possible trend reversal and bullish breakout.
- The MACD crossover and RSI rising above 50 indicate growing buying interest, supporting the case for a sustained upward move.
- Traders are watching key resistance at $3, as past breakouts from similar patterns have led to significant price rallies.
Sui (SUI) has recently broken out of a descending channel, signaling a potential shift in its trend. Trading at $2.57 at the time of writing, the asset shows gains of 4.62% over 24 hours and 8.19% over the past week. Technical analysis points to a setup for upward movement, with key resistance and support levels under close observation.
Analysis of Price Action
Michaël van de Poppe noted that SUI experienced a notable retest and opportunity at its current levels. His analysis indicates that the price broke above the upper trendline of a defined descending channel. This breakout may suggest that buyers have entered the market. His observations also indicate that the uptrend may have started from this point.
Van de Poppe’s analysis further shows that SUI has recently broken out from its bearish channel. He mentioned that the price action demonstrates a shift that could mark the start of a new upward phase. These remarks provide technical details on how the price has moved and establish key levels that require monitoring as the trend evolves.
Analysts Insights
Trader Edge also provided technical insights, noting that SUI has broken out from a bullish falling wedge pattern on the daily chart. According to his analysis, the asset has previously experienced significant rallies when similar patterns occurred. His data points to the importance of watching the next resistance level, which is observed around the $3 mark.
Trader Edge’s technical view emphasizes that the falling wedge formation may catalyze further price increases. His analysis notes that past occurrences of this pattern led to marked market rallies. This pattern, combined with the recent breakout, provides a technical framework that supports a focus on resistance near $3. Traders are advised to monitor trading volume and price levels as the pattern continues to unfold.
Technical Indicators and Key Levels
Supporting these observations are several technical indicators. The Moving Average Convergence Divergence (MACD) shows the blue line at 0.0625 and the signal line at -0.1151. Although the histogram is currently at -0.1777, the setup suggests that momentum could shift if the histogram turns positive.
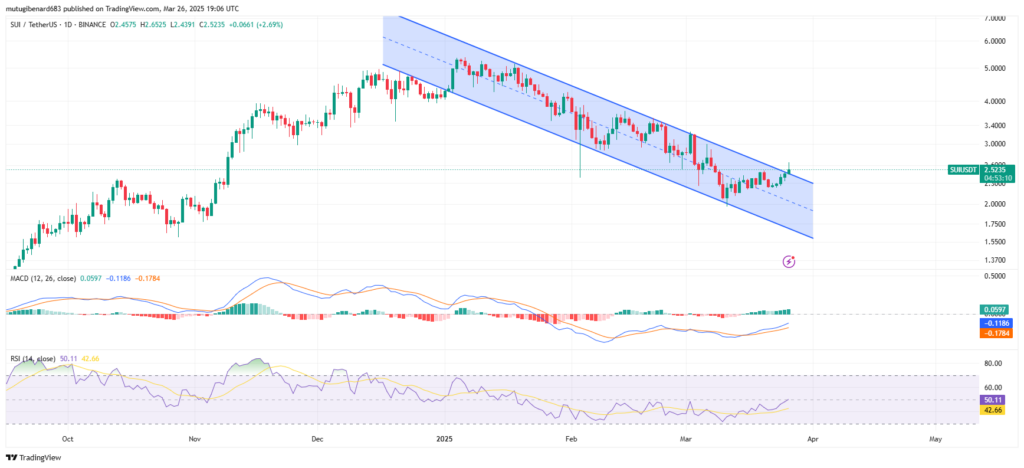
The Relative Strength Index (RSI) stands at 51.43, having breached the neutral line of 50. This rise in the RSI may indicate mounting buying pressure. The nearest resistance would be in the range of $2.80 to $3.00, while the support would be in the range of $2.30 to $2.40. These are the ranges market players are observing, as they are obvious targets for the next price direction.