
- SUI confirms a Head and Shoulders breakdown with the breach of the $3.00 support and signaling a strong bearish trend.
- Technical tools including MACD and DMI also reflect additional selling and enhance bearish SUI momentum.
- Traders will either be targeting a recovery higher at $3.00 or lower at $2.50 and $2.20 depending on the reaction of the market.
SUI has dropped below a critical support level, trading at $2.76. This marks an 8.63% decline over the last 24 hours and a 9.18% drop in the past week. The breakdown below $3.00 follows a Head and Shoulders pattern, which traders recognize as a bearish structure.
Head and Shoulders Breakdown and Market Reaction
Veteran cryptocurrency analyst Ali Martinez detailed the formation of the Head and Shoulders pattern. The price initially moved higher to construct the left shoulder and a higher top formed the head. The right shoulder concluded with a lower top that showed weakening bullish strength. The neckline that forms a crucial area of support was breached at the price of around $2.80. The lower price targets are closely followed by the traders with the anticipation of a further price fall based on the pattern.
Ali’s analysis emphasizes the significance of this technical formation in signaling the future direction of the market. The violation of the neckline has been a bearish confirmation historically that matches the latest downward move of SUI’s price. The post emphasizes the likelihood of price behavior such as further downward pressure if the price maintains trading below critical support levels.
Technical Indicators Indicate Selling Pressure
Directional Movement Index (-DI) of 26.26 surpasses +DI of 14.69 and indicates that the sellers are firmly in charge. Average Directional Index of 29.60 is near 30 and typically confirms a strong direction.
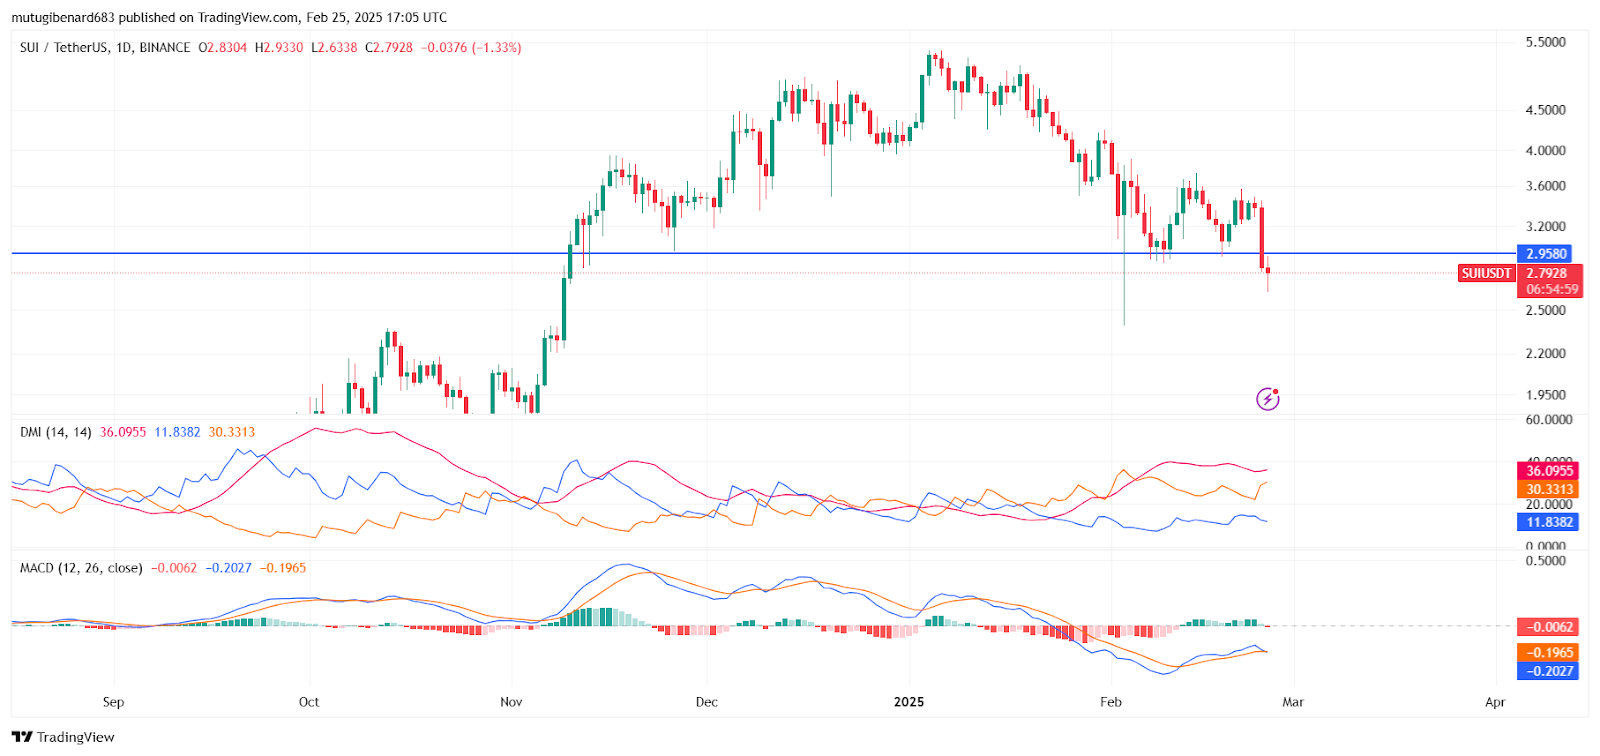
The MACD also goes with the bearish tone. The MACD line (-0.28) is still lower than the signal line (-0.19), and the histogram also remains in the red zone, indicating constant selling pressure. The indicators imply that the direction of the trend is still downward unless a change happens in the dynamics of the market.
Key Focus Points and Potential Price Actions
A move back above $3.00, supported by strong buying volume, could indicate a possible recovery. A MACD crossover and a decrease in -DI strength would support this scenario. However, if the price remains under $3.00, further declines toward $2.50 or even $2.20 could occur. A rising ADX above 30 and further MACD weakness would confirm continued downside momentum.
Market players closely observe the price movement of SUI to gauge if it will be able to recapture the lost ground or keep falling.