
- Stellar’s XLM price hovers around $0.2995, showing a 9.90% daily gain despite a 9.07% decline over the past seven days.
- A bullish flag pattern suggests a potential 330% breakout, with key resistance at $0.42 and possible targets at $0.63 and beyond.
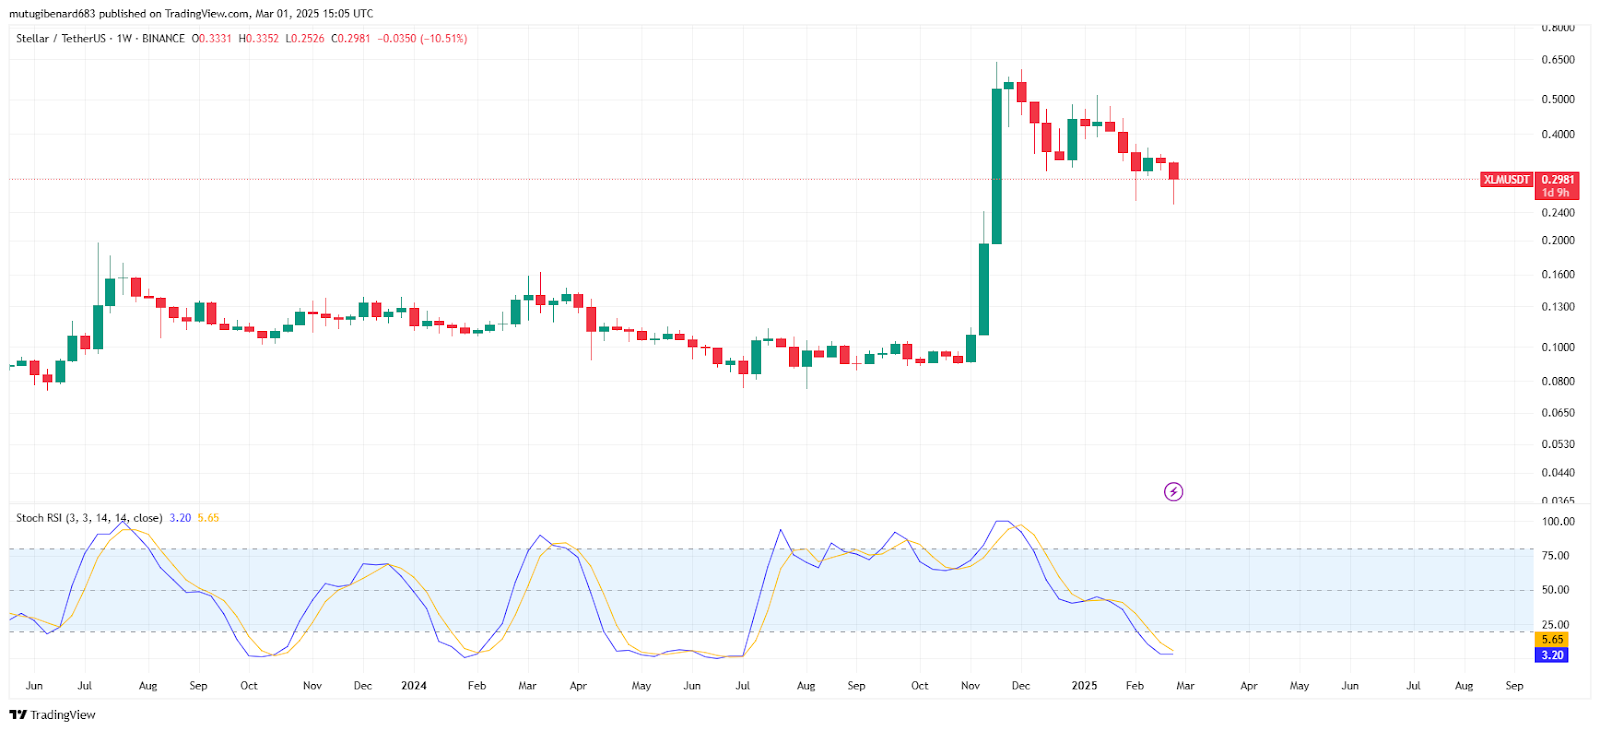
- Stochastic RSI remains oversold at 3.20 and 5.65, hinting at a possible reversal if momentum strengthens above the $0.27 support level.
Stellar’s XLM has drawn renewed attention as technical analysts watch for a possible upward breakout. The token’s recent price swings, combined with key chart signals, have prompted discussions about a potential shift in market sentiment.
Recent Price Behavior
At the time of writing, XLM stands at $0.2995, with a 24-hour trading volume near $271,136,103. This figure reflects a 9.90% rise in one day, although the weekly change is -9.0%.
Late 2024 brought a sudden climb above $0.60, but a subsequent pullback has placed the token below $0.30. Observers note that lower highs and lower lows suggest cautious trading until a clear directional move emerges.
Market participants mention a descending channel that might be forming a bullish pattern. Some interpret it as a falling wedge, pointing to a potential rebound if buyers overcome recent selling pressure.
Technical Observations
Crypto veteran Ali Martinez shared a post regarding a possible bullish flag, predicting a 330 percent breakout if certain levels are cleared. The analyst pointed to a descending channel and emphasized that a breakout above its upper trendline may signal a reversal.
Fibonacci retracements at 0.236 through 1.0 remain under scrutiny. The 0.2832 zone acts as support, while 0.3050 stands as near-term resistance.
Some traders expect a climb toward $0.42, with possible extensions at $0.63, $1.08, or even $2.14. These targets rest on the idea that a wedge breakout could spark renewed buying enthusiasm.
Momentum Indicators and Key Support
Stochastic RSI readings near 3.20 and 5.65 reveal oversold conditions, hinting at a possible rebound. Analysts suggest waiting for a bullish crossover, since downward pressure may persist if the indicator remains below 20.
Market watchers also focus on the $0.27 area, which could provide a floor for a short-term bounce. A slip below that mark could send the price toward $0.20, prompting concerns about extended downside movement.
A move above $0.42 is an early sign of renewed upward strength. Failure to break that level may leave XLM in a range, pending stronger volume and market participation.