

- The 50-day exponential moving average supports Sperax (SPA) at this level as it indicates positive market sentiment moving into potentially higher price areas.
- SPA price pushed against a significant resistance area ranging from $0.035 to $0.040, while a successful breakout could push it towards $0.045 to $0.050.
- Stochastic RSI indicates SPA is oversold, suggesting a potential upward reversal if a bullish crossover confirms renewed buying pressure.
Sperax (SPA) has demonstrated resilience, maintaining upward momentum while Bitcoin experienced downside pressure. With the price holding key support levels and technical indicators signaling potential bullish continuation, traders are watching SPA closely for its next move.
Price Action and Resistance Levels
Crypto analyst JavonMarks highlighted SPA’s continued breakout, noting the potential for further gains toward the $0.21605 target. The price recently surged into a key resistance zone around $0.035-$0.040 before retracing to $0.023. This pullback suggests healthy consolidation after a strong rally.
The historical resistance zone has acted as a barrier, rejecting price advances multiple times. If SPA successfully breaks above this level, it could trigger a push toward the next major resistance range of $0.045-$0.050. Failure to surpass resistance may lead to another test of lower support.
Support from Moving Averages
The 50-day exponential moving average (EMA) at $0.0198 has provided crucial support. A shorter-term EMA sits just below, further strengthening this support level. The price bouncing off these EMAs indicates that buyers are defending this zone.
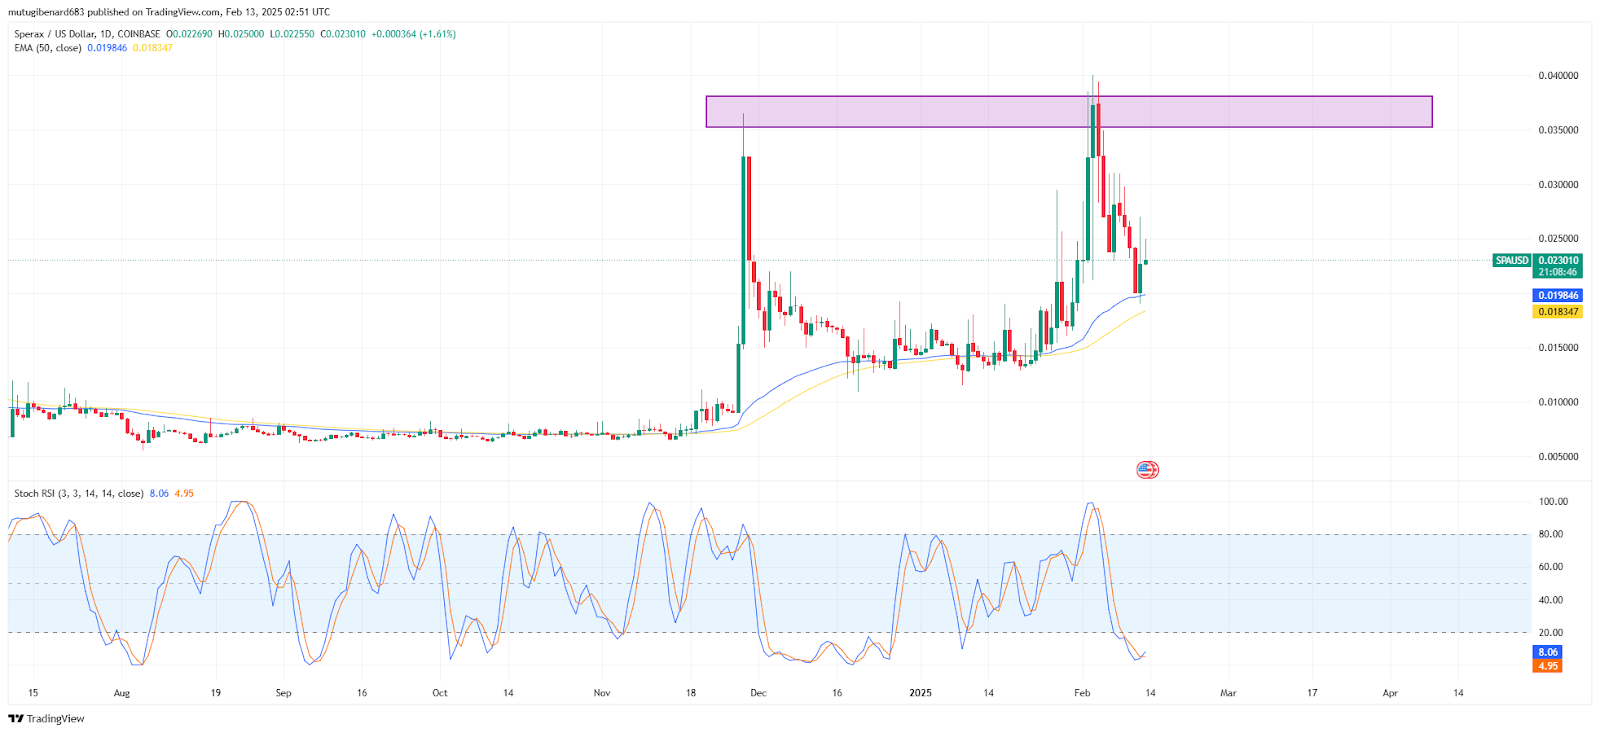
As long as SPA holds above these EMAs, bullish sentiment remains intact. A decisive break below could shift momentum, bringing support levels at $0.018-$0.020 into focus. The price must stay above these indicators to sustain its upward trajectory.
Stochastic RSI and Market Momentum
The Stochastic Relative Strength Index (RSI) signals that SPA is in an oversold region, with values of 8.09 (blue) and 4.96 (orange). This suggests a potential upward reversal if the Stochastic RSI crosses upwards.
If the indicator confirms a bullish crossover, traders could anticipate renewed buying pressure. This could provide the momentum needed to break through key resistance zones.
SPA traded at $0.0234 during press time, which indicated a 17.71% boost from yesterday yet showed an 19.59% decrease from the last week.