
- Solana tests key $80 support after repeated breakdowns, with analysts split on rebound or deeper correction.
- Crypto Patel flags a potential buy zone while others highlight a trendline test and uncertain structure shift.
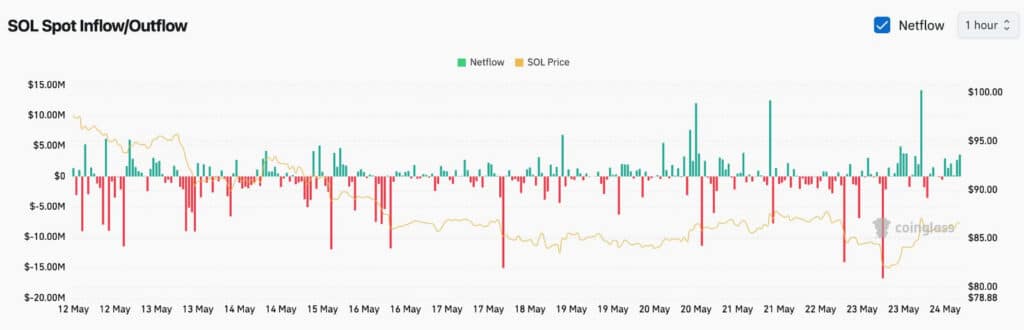
- Exchange data shows alternating inflows and outflows, signaling ongoing volatility between $80–$95 range.
Solana is under focus with analysts commentary outlining key price zones and flow activity around recent trading support levels. Analyst Crypto Patel highlighted potential buy zone, while Ted Pillows noted trendline test and Crypto With Haris discussed recent dip and recovery behavior.
Analyst Price Levels and Buy Zone Claims
Analyst Crypto Patel said SOL is in a buy zone that previously led to a 2,200% move. Ted Pillows described a trendline moment, stating price could rebound or fall to new lows. Both comments focused on Solana structure around key technical levels and market direction.
The commentary highlighted different outcomes depending on whether support holds or breaks. However, no timeframe or exact catalysts were provided in the statements. The analysis remained centered on price structure and historical reaction zones.
Flow Activity and Short-Term Trader View
Crypto With Haris addressed recent price behavior and rejection of panic narratives. He referenced a prior move toward the $84 area and a sweep near $81.5. He said buyers re-entered market conditions as green candles appeared around support.

The chart showed persistent volatility with alternating inflows and outflows across sessions. Large red spikes marked outflows between $12 million and $17 million on multiple dates. Green inflows reached $12 million to $15 million, showing intermittent buying activity.
Support Levels and Exchange Flow Shifts
The chart placed SOL near a key $80 support zone after repeated selling pressure. Earlier price levels showed SOL trading near $98 to $100 before gradual decline. Resistance remained near $90 to $95 where prior breakdown activity occurred.
Inflows suggested possible stabilization above support during short recovery attempts. However, outflows continued to reappear across the same trading window. Short-term movement reflected alternating liquidity pressure across exchange activity data.
The data showed repeated shifts between accumulation and distribution phases. Each spike aligned with visible volatility across the broader trading range. Market structure remained compressed between support and resistance zones.