- The present support range for Solana spans from $179-$180 then extends to target prices of $210-$230 while facing resistance between $202-$210.
- The combination of Bollinger Bands with Stochastic RSI indicates a possible price reversal through measurements of oversold market conditions before a temporary price rise occurs.
- A move beyond $270 would drive Solana’s price above $300 but unsuccessful support maintenance may push the market down to $157 to $160.
Solana is testing a major support zone, with traders closely watching its price action. Holding above the level could mean the continuation of its uptrend, but failure to support could lead to further drops.
Support and Resistance Levels
A recent tweet by ali_charts points out that Solana is currently testing the lower boundary of its ascending channel. If support is held, an uptrend can push the price towards $387. The nearest support zone is the $179-$180 area, which also aligns with the 0.5 Fibonacci retracement level. Holding this area can make the price bounce back towards $210-$230.
On the resistant side, the price has a barrier at $202-$210, which is in line with the 0.618 Fibonacci retracement level and the mid-channel trendline. A breakout above this level can propel gains with targets at $250 and $295. But going under $179 can lead to further losses, with significant support levels at $157 and $138.
Technical Indicators and Market Trends
Solana has been trending in an upward channel since October, with the lower edge acting as strong support. The upper edge, which currently stands at approximately $280, is a potential resistance zone. A recent bounce from the lower trendline shows that buyers are active in the $180-$190 zone.
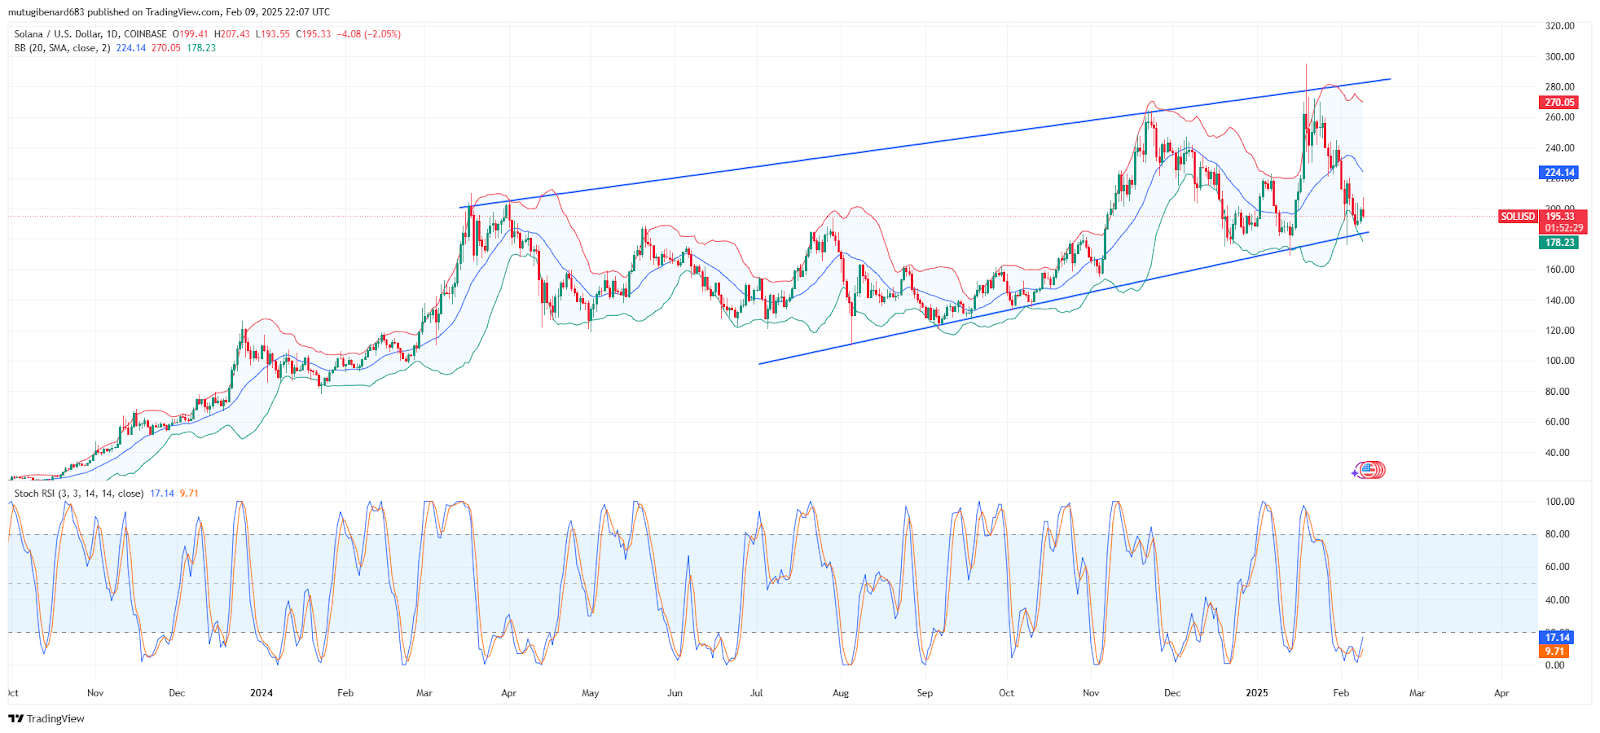
Bollinger Bands show price trading near the middle band (20-day SMA) of $224.40. The upper and lower bands are $269.71 and $179.10, respectively. Historically, bounces off the lower band price have led to upward momentum.
Stochastic RSI value of 21.15 (blue) and 11.05 (orange) for Solana indicates that it is in the oversold region. It reflects the potential price bounce on the short-term basis, re-establishing the possibilities of a push towards $224-$240.
Future Outlook and Price Movement
The Solana price might rise to between $210-$230 levels if it stays above $180-$190 values. The price will confirm bullish strength around $270 as it rises above this level while having potential to reach $300. The price will likely fall down to $157-$160 if the market loses support strength.
Traders continue to watch Solana closely at its current position because they need to confirm which direction the upcoming trend will go. During writing this report Solana traded at $200.67 while showing 2.33% growth since yesterday and 2.74% depreciation during the last week.