
- Solana fell from $101.36 to $95.84, with 72M SOL previously traded around the current $96-$97 support zone.
- U.S. spot SOL ETFs recorded over $200M in inflows during the past month, alongside 3M SOL withdrawn from exchanges.
- SOL faces resistance at $98-$100 and $102-$104, while a break below $96 could expose lower support levels.
Solana fell from $101.36 to $95.84 after reports that the CLARITY Act failed to advance in the U.S. Senate. Analyst Ali Charts identified the area as major support, citing 72 million SOL previously traded there. Meanwhile, spot SOL ETF inflows, exchange withdrawals, and new addresses have continued rising despite the correction.
SOL Holds a Major Support Zone
Ali Charts said SOL is testing an area where 72 million tokens previously changed hands. The analyst identified that trading history as a significant support zone. On the chart, SOL currently trades near $97.39.
The latest candle opened at $97.26, reached $97.40, fell to $96.90, and closed at $97.39. Price had earlier moved between $100 and $104, with repeated resistance near $104–$105. After reaching about $104.5 on September 15, SOL dropped below $102 and then $100.
The decline continued toward $96.2–$96.5 on September 16, with elevated volume during the breakdown. Price later consolidated near $97.
ETF Inflows Rise as Exchange Supply Falls
While SOL remains near support, Ali Charts reported nine straight weeks of net inflows into U.S. spot SOL ETFs. More than $200 million entered those products during the past month. At the same time, more than 3 million SOL left exchanges over the past month.
That decline reduced the amount of SOL readily available on exchanges. Network activity has also remained high, according to Ali Charts. Solana recorded 12 million new addresses on September 11 and continues creating roughly 10.8 million new addresses daily.
Momentum Remains Below Neutral Levels
The chart shows RSI at 38.61, while its moving average is at 33.98. RSI remains below 50, while its recovery from near oversold levels shows recent movement. Meanwhile, MACD remains negative at -1.01 against a signal line of -1.07.
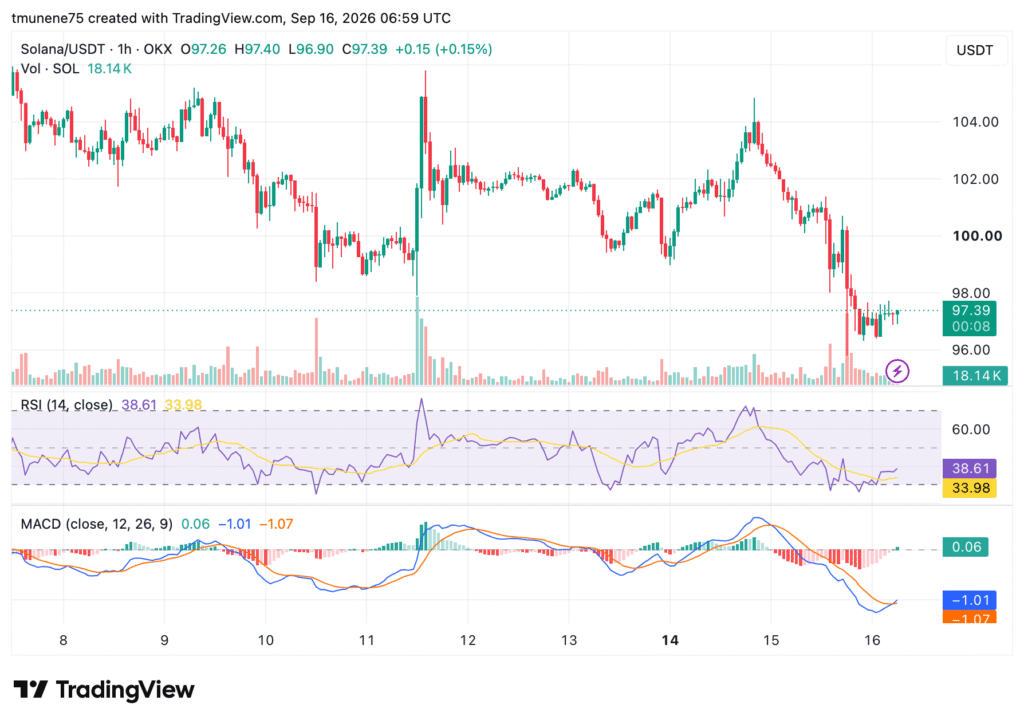
The histogram is slightly positive at 0.06, with both lines beginning to turn upward. Key support is around $96–$97, followed by approximately $95. Immediate resistance appears near $98 and $100, with stronger resistance around $102.
A recovery above $100 would place attention on the $102–$104 range. However, a break below $96 would expose lower levels.