
- SHIB broke out of a descending trend line, which indicated that buyers started entering this important support area.
- An upcoming intersection of the 50-day and 200-day EMAs might validate an upward trend, thus directing prices toward essential resistance levels.
- A bullish crossover on the MACD indicator signals weaker bearish momentum that suggests SHIB should continue moving upward.
The technical market indicators suggest that Shiba Inu (SHIB) demonstrates potential signs of recovery. A weekly chart indicates a buy signal through the TD Sequential indicator that suggests an upcoming trend change.
Support and Resistance Levels
Ali, a crypto analyst, noted that SHIB recently bounced off a strong historical support zone, marked by the purple-shaded area on the chart. This suggests that buyers are stepping in to prevent further downside. The next challenge for SHIB lies at the 0.00002051 level, where the 50-day EMA currently acts as resistance.
If SHIB maintains its position above this support, it could push toward the resistance range of 0.00001950 to 0.00002050. A successful breakout above these levels may pave the way for further gains. On the other hand, failure to hold above 0.00001600 could see SHIB retest lower support zones around 0.00001400.
Technical Indicators Suggest a Potential Reversal
A key development in SHIB’s price action is the breakout above a downward-sloping trendline that had previously capped upward movement. While this breakout is an encouraging sign, it requires confirmation through sustained price action above this level.
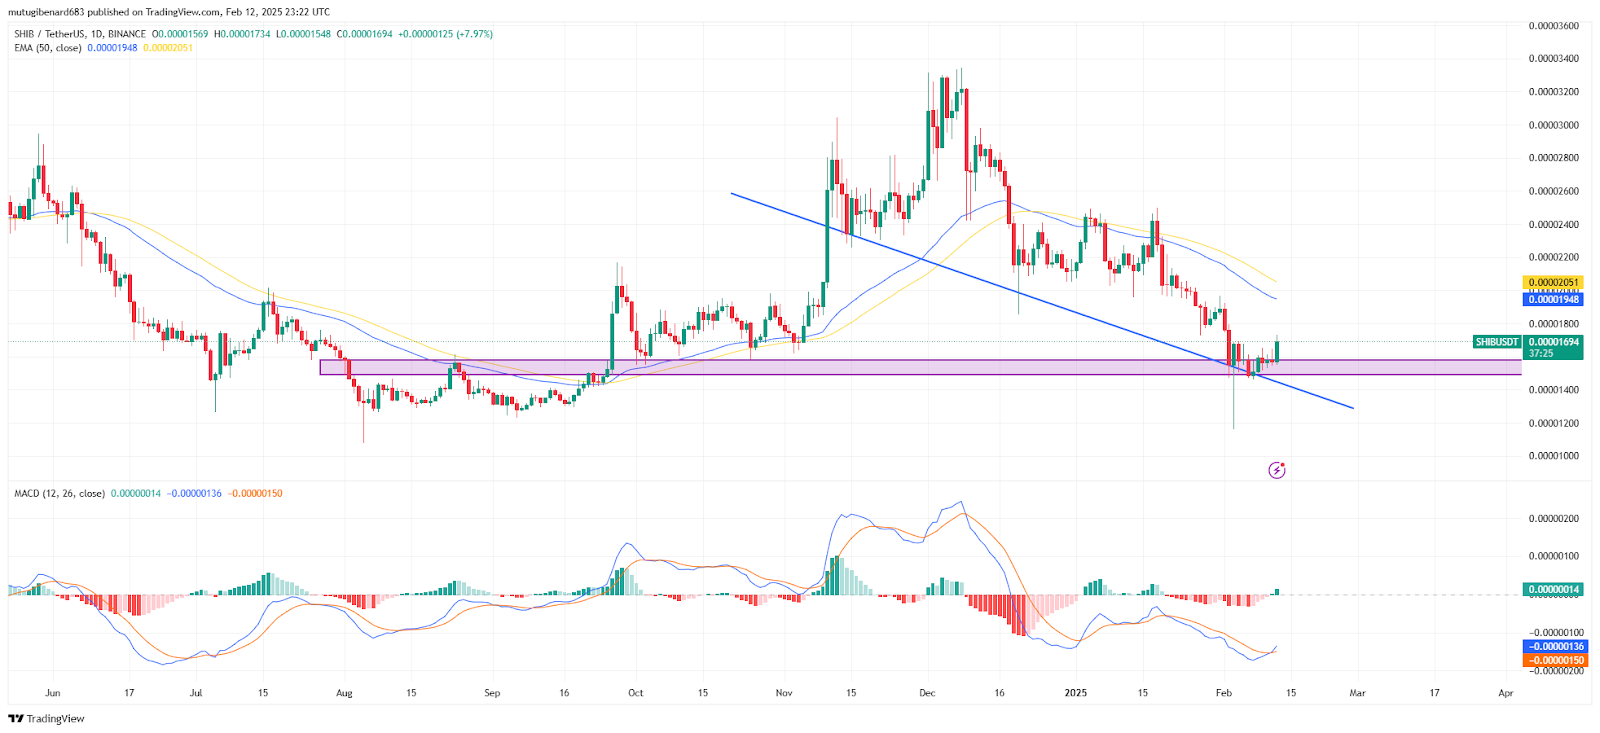
The 50-day and 200-day EMAs are also converging, and if a crossover occurs, it could signal a long-term trend reversal. Currently, SHIB is trading below both EMAs, indicating that the broader trend remains bearish until a confirmed breakout.
Momentum Indicators Show Weakening Bearish Pressure
The MACD histogram produces declining red bars that indicate bearish momentum is weakening. A potentially bullish crossover becomes more likely due to both the upward curve of the MACD line and the signal line in the same direction. Such a development signifies a momentum transition, which could result in additional price growth.
The SHIB price approaches a vital point that triggers intense market observer interest as they await evidence of market expansion or withdrawal signals. At the time of writing, Shiba Inu (SHIB) was at $0.00001677 while demonstrating a seven percent upswing in twenty-four hours and a five percent increase since the previous week.