
- SHIB recovery remains intact while price holds the rising channel and support near $0.0000045, preserving higher lows since July now.
- RSI around 57.5 is still in buy territory, MACD is still over its signal line and the daily bias continues to be bullish for the time being.
- Breaking above $0.0000062 will open up the upper channel around $0.0000065, while support is vital for further price gains.
SHIB has reached an important technical milestone, with its price consolidating within the rising channel after attempting to make a sharp breakout, and now it is crucial to see if momentum can continue to keep rising.
Long-term structure shifts toward recovery
Crypto analyst Crypto Sheriff says Shiba Inu has moved beyond prolonged decline and consolidation. His cycle model divides the broader structure into decline, consolidation, recovery, and rocket phases. The view follows a breakout above a descending trendline that capped SHIB for years.
TheCryptoBasic introduced Sheriff’s analysis through a recent post discussing the changing market structure. The post says that SHIB was able to trade below that downtrend line for about five years. This is the longest period of time since October 2021 when all-time highs were reached around $0.00008845.
The price consolidated at its lower trading range after the downtrend for a prolonged period.The token maintained resistance for most of that time, despite selling pressure. The recent trend line break is thus a turn in the tide from a days of weakness to recovery.
Sheriff expects the recovery phase could eventually develop into a stronger rocket phase. However, the current structure still requires sustained trading above reclaimed trendline territory. A failure there would leave the broader cycle transition less firmly established.
Daily chart shows rising channel
The price is consolidating around $0.00000530 on the daily chart after seeing a huge rally recently. Price had fallen from approximately $0.0000045 to $0.0000062 prior to its next sell-off. Those rejections created an upper wick and some weaker candles at some resistance.
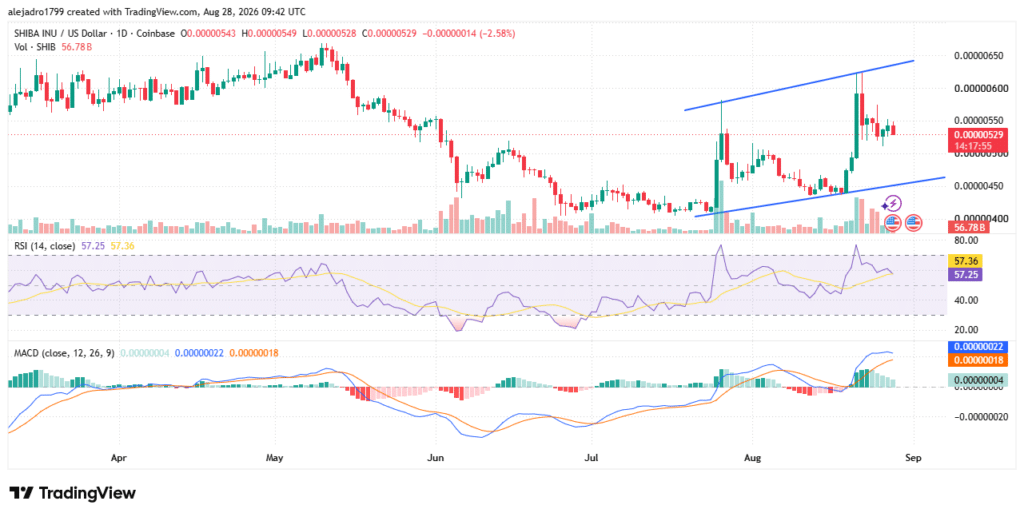
Since then, price has been consolidating around $0.0000053 in the rising channel. The bottom channel border is now sitting at a significant support level at $0.0000045. If that structure is maintained, it will maintain the sequence of higher lows since July.
The near-term resistance area is now at $0.0000060 through $0.0000062. Breaking above that level could pave the way for $0.0000064–$0.0000065. On the other hand, if the price moves back downwards, it may be moving towards the bottom of the channel.
Volume also increased during the strongest upward move shown on the daily chart.
The following retreat appears less forceful than the preceding surge in buying activity.
That pattern leaves the market waiting for clearer confirmation around resistance and support.
Momentum indicators keep the recovery constructive
The RSI as of writing, stands near 57.5, keeping momentum above the neutral 50 level. It remains below overbought territory, leaving room for further movement without extreme readings. The indicator also recovered from weaker levels recorded during the June decline.
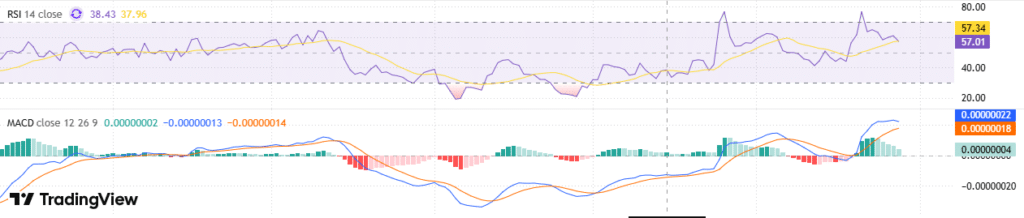
However, the MACD line is still above its signal line on the daily chart. The histogram is positive indicating reinforcing momentum following the recent upward move. However, recent price consolidation suggests momentum has moderated after the sharp rally.
The chart therefore places greater importance on the next confirmed directional move. Holding $0.0000050–$0.0000045 would keep the current bullish structure technically supported. A sustained break below that zone could weaken the recovery setup considerably.
For now, $0.0000062 remains the clearest upside test on the displayed structure. A successful breakout could bring the upper channel near $0.0000065 into focus. Until then, the chart continues to show recovery rather than a confirmed rocket phase.