- SHIB is holding a 3-year inverse head and shoulders structure, with neckline resistance now facing increasing pressure.
- A breakout above the neckline could trigger a 5X rally, with targets at $0.000065 and $0.000081.
- Price remains range-bound near $0.00001200–$0.00001300, as MACD and RSI point to tightening momentum.
Shiba Inu is pressing against a three-year neckline resistance, holding firm within a massive inverse head and shoulders setup. With momentum tightening and buyers defending key levels, SHIB could be gearing up for its biggest breakout since the 2021 bull run.

Multi-year reversal structure still intact
As per a TradingView chart shared by JavonTM1, Shiba Inu has been shaping an inverse head and shoulders from as early as 2022. The first shoulder formed in mid-2022 during a steep correction.
By late 2022, SHIB hit deeper lows, establishing the head. A rebound followed in 2023, leading to the second shoulder into early 2024, set above the head and aligning with the first shoulder’s level.
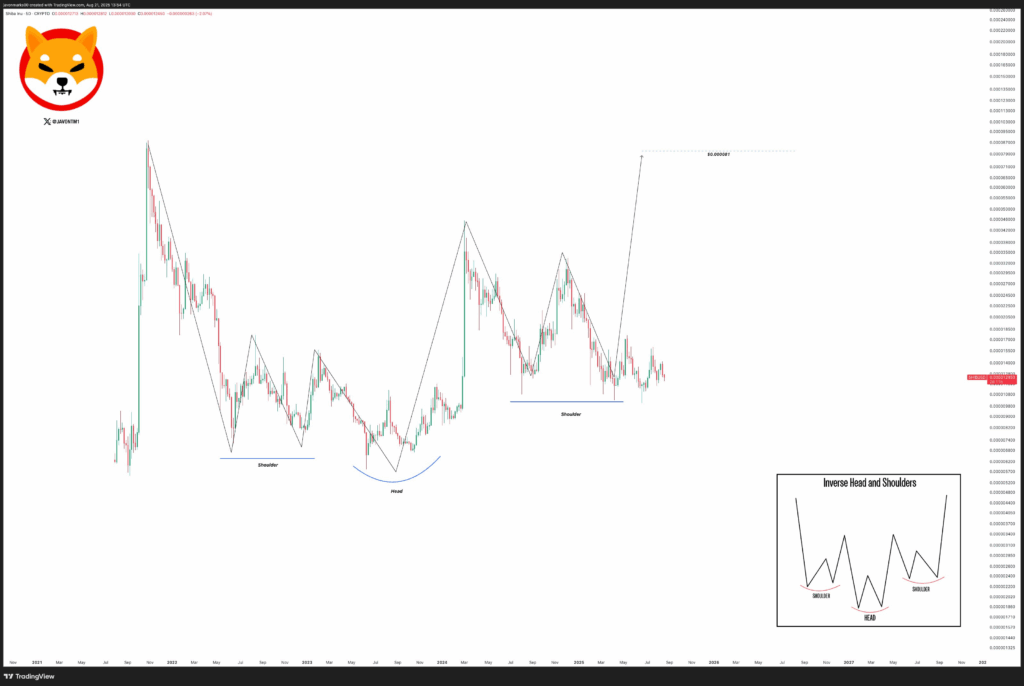
The structure remains symmetrical and proportionally consistent, matching the textbook reversal model shown alongside the chart. The neckline stretches horizontally between shoulder and head, marking the breakout line.
Throughout 2025, SHIB has traded below the neckline, holding bullish formation intact. If it breaks out, projected targets lie between $0.000065 and $0.000081 mark. If the projected 430%–540% surge happens it could possibly lead to new all-time highs.
Near-term signals and market behavior
While the larger structure hints at a major breakout, SHIB’s near-term action shows range-bound trading. On Binance’s 4-hour SHIB/USDT chart, price trades at $0.00001238, slipping 0.32% intraday. Candles reflect indecision with repeated tests of $0.00001200 support and rejections near $0.00001300 resistance.
Source CryptoRank
Momentum indicators echo this consolidation. The MACD line is edging closer to the signal line, showing bearish momentum is starting to cool off. RSI sits at 42.96, just below neutral. Both indicators reflect sideways movement, with no strong trend taking over just yet.
Volume remains steady overall, though brief spikes still show stronger selling activity during short-term price dips. Still, the repeated defense of $0.00001200 support shows buyers are active in the shoulder zone, protecting the integrity of the long-term bullish setup.
What to watch next
SHIB’s structure holds as long as the second shoulder’s support isn’t breached. A confirmed breakout above the neckline would unlock upside toward $0.000065 and potentially beyond. Until then, the token is consolidating in a tightening range.
If momentum builds and neckline resistance finally gives way, Shiba Inu may be on the verge of its most significant rally since 2021.