
- SHIB remains inside a tightening formation, with descending resistance and rising support defining the immediate technical structure.
- Momentum has weakened after August’s recovery, while RSI remains neutral and MACD signals fading short-term strength.
- The $1 target requires extraordinary repricing, while the current chart shows no direct technical pathway toward that level.
SHIB remains locked within a tightening structure as traders assess a bold $1 target against current technical conditions and recent market behavior.
SHIB Faces a Wide Gap Toward $1
The $1 target has drawn attention through SHIBMortal’s latest question about Shiba Inu. The post asks whether such a valuation could arrive within 30 days. However, the accompanying graphic does not present a specific technical route.
Instead, the image places the $1 figure alongside the Shiba Inu branding. The timeframe makes the target considerably more demanding than a longer-term scenario. Current market structure provides a clearer reference for assessing that distance.
The displayed chart places the current price near $0.00000506. That level remains far below the proposed $1 valuation. The difference requires an extraordinary repricing across the token’s existing supply.
The supplied market data also shows approximately 589.2 trillion SHIB circulating. At $1, that supply would imply roughly $589 trillion in market capitalization. Therefore, the target involves a valuation transition far beyond ordinary short-term market movements.
Daily Structure Shows Tightening Price Action
The daily chart shows a prolonged decline from the May recovery toward June lows. Price subsequently established a base around the $0.0000040–$0.0000045 region. That area became an important foundation during the summer recovery.
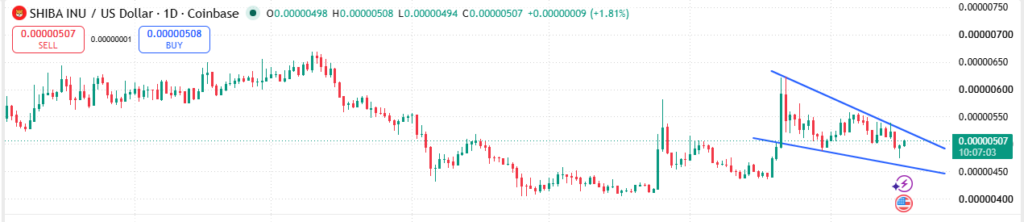
Late July brought a sharp expansion toward approximately $0.0000058. Price then retreated before another advance developed during August. The second rally reached approximately $0.0000062 before encountering descending resistance.
Since that August peak, lower highs have developed beneath the upper blue trendline. Meanwhile, the lower trendline has continued rising beneath price. Together, these boundaries create a narrowing formation across the recent trading range.
The latest candle shows a gain of approximately 1.61%. However, price remains below the descending resistance line overhead. The structure therefore remains dependent on either a breakout or support failure.
MACD and RSI Show Moderating Momentum
The MACD has weakened following the stronger momentum seen during August. Its latest histogram readings have moved into negative territory. The MACD lines are also turning lower as recent strength fades.
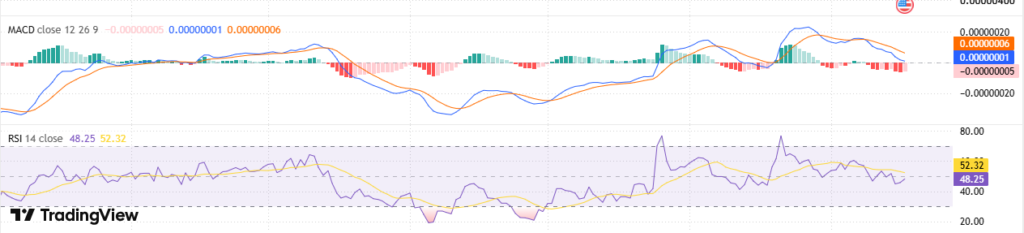
The RSI as of writing reads approximately 47.98, while its moving average stands near 52.30. Those readings place momentum around the middle of the indicator’s range. Neither measure currently signals an extreme overbought or oversold condition.
The technical setup therefore remains balanced around the contracting formation. A break above descending resistance would challenge the recent sequence of lower highs. Conversely, losing rising support could expose the lower areas established during June and July.
For the $1 question raised by SHIBMortal, the chart provides limited evidence. It shows consolidation rather than a direct sequence toward the distant target. The immediate focus remains on whether SHIB can resolve its current formation decisively.