- SEI has broken through the previous consolidation, forming an inverse head and shoulders pattern, suggesting the possible upturn to $0.38.
- The Relative Strength Index (RSI) is climbing, and the Directional Movement Index (DMI) also implies a failing bear trend, affirming bullish support.
- If SEI crosses above $0.2497, it could rally to the area of $0.35 – $0.38, and if unable to hold, could retest the area of $0.22 – $0.20.
SEI is displaying strong bullish momentum as it breaks out of consolidation and pushes against key resistance levels. With an inverse head and shoulders pattern forming, traders are anticipating a move towards $0.35 – $0.38 if the breakout is confirmed.

Inverse Head and Shoulders Pattern Confirms Bullish Reversal
According to a recent tweet by SuzzyDefi, a fulltime crypto trader, SEI is signaling a bullish reversal as it forms an inverse head and shoulders pattern. The price has been making higher lows and is pressing against the $0.2497 resistance level. If it clears this level, SEI could see a strong rally toward $0.36 or higher. On the downside, key support levels at $0.2104 – $0.2200 remain intact, acting as a safety net for buyers.
Market structure indicates that SEI was previously in a downtrend before entering a consolidation phase. A break above the descending trendline has weakened bearish momentum, further supporting the bullish outlook.
Technical Indicators Support a Bullish Breakout
Key technical indicators are suggesting bullish pressure building. The RSI at 52.28 suggests upward movement, and a breakout above 60 could establish the trend to be bullish.
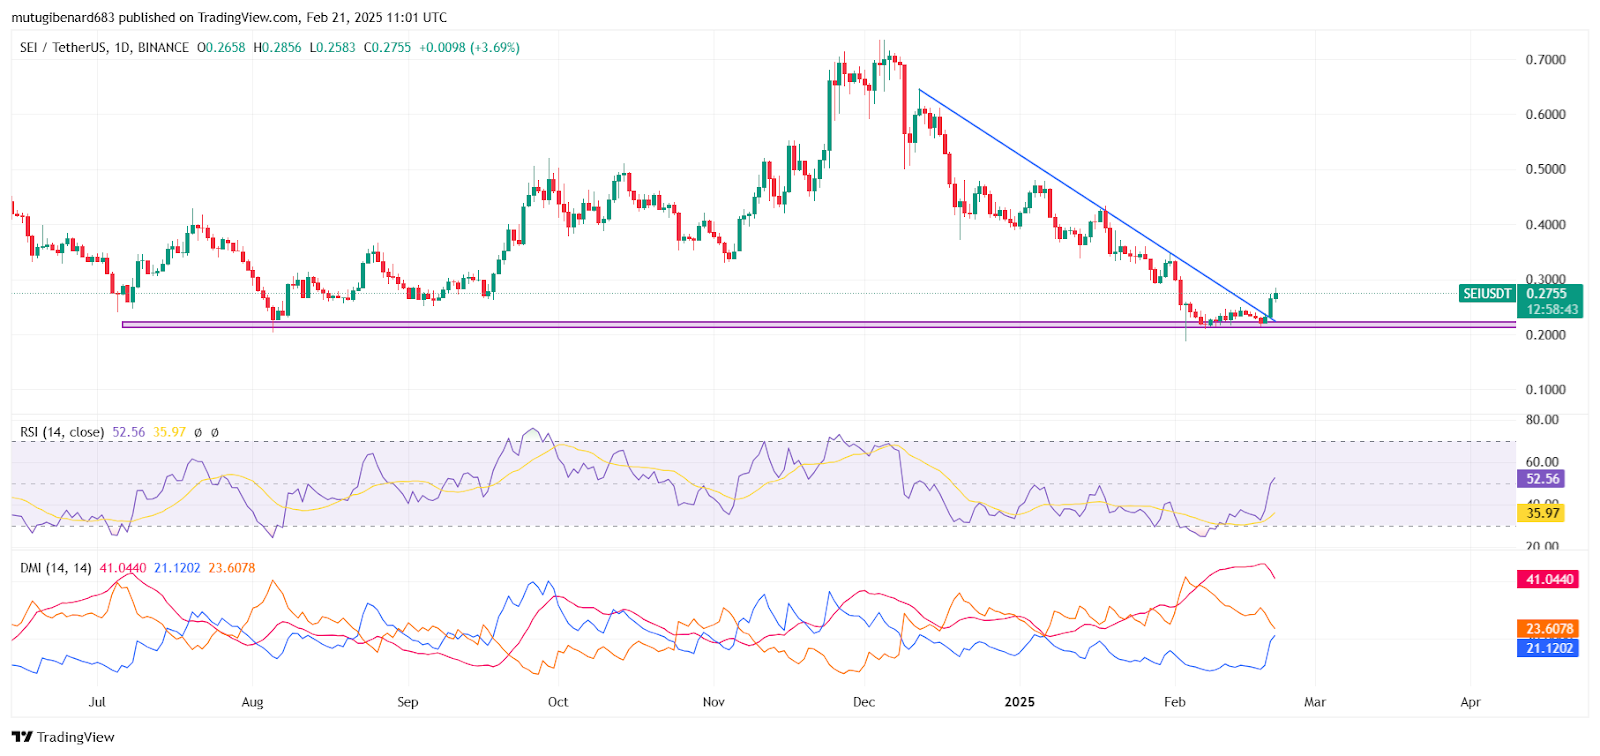
The Directional Movement Index suggests building buying pressure, and the +DI at 21.12 and the -DI at 41.04 are dropping. The Average Directional Index at 23.60 suggests the trend to be medium in terms of strength, and a breakout above 25 could establish the trend to be bullish.
Key Levels to Watch and Future Outlook
The critical level to monitor is $0.2497. If SEI sustains above this resistance, it could push towards $0.35 – $0.38. A failure to break out could result in a retest of support around $0.22 – $0.20. Traders are closely watching for confirmation as SEI’s momentum builds. Over the last 24 hours, SEI has surged 10.47%, with its price at $0.276 at publication with a trading volume of $258,268,621.