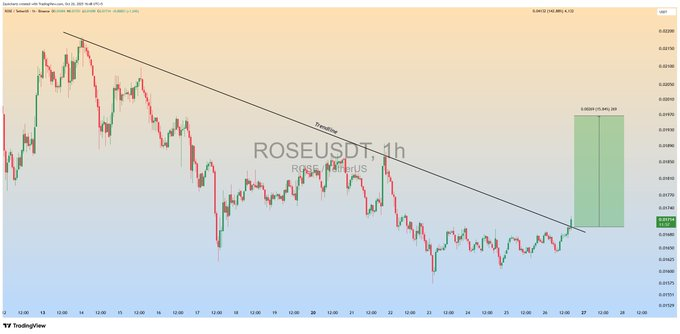
- $ROSE breaks long-term trendline resistance, hinting at a structural shift toward a bullish phase.
- Rising volume and RSI recovery support the ongoing upward momentum in Oasis Network’s token.
- Market targets between $0.01974 and $0.02329 suggest continued upside potential if breakout holds.
Oasis Network ($ROSE) is signaling a possible trend reversal after a prolonged downtrend. Technical momentum and price action suggest improving market sentiment as traders monitor the token’s ability to sustain above a recently broken resistance line.

$ROSE Shows Strength as Breakout Sparks Bullish Momentum
Oasis Network ($ROSE) is displaying renewed technical strength following a breakout above a key descending trendline that had restrained price action for several weeks. The latest chart shared by ZAYK Charts (@ZAYKCharts) illustrates this pivotal moment, where $ROSE has successfully breached its downtrend structure on the 1-hour timeframe.
For an extended period, $ROSE traded in a defined channel of lower highs and lower lows, indicating sustained bearish control. However, as price reached the lower boundary of this structure, buying activity began to emerge. Successive attempts by sellers to drive the token lower were met with firm buy reactions, suggesting accumulation at discounted levels.
The breakout candle that cut through the descending resistance line confirms the shift in momentum. This firm body close above the trendline typically signals the end of bear control and the beginning of structural recovery. A retest of this level as support can increase the likelihood of further upward action, potentially starting a bullish wave.
Growing Volume and Technical Indicators Signal Market Awakening
Outside the breakout pattern, the market data shows rising investor confidence in the token of Oasis Network. Over the last 24 hours, $ROSE recorded a gain of 3.51%, trading at about $0.01724. Market capitalization stands at $127.89 million, with daily trade volume up 15.21% to $3.19 million, showing renewed activity and flow of liquidity.
Analyst Bithereum_io identified a falling wedge formation on the daily chart — a pattern often preceding trend reversals. The rally of the token off of the wedge’s lower trendline reflects diminishing selling momentum as buyers gained ascendancy. This pattern, combined with improving market structure, confirms hope in a continuation of the current uptrend.
The momentum indicators have also turned positive. RSI and MACD are giving indications of positive cross overs, which signify an increasing optimism among traders. When combined with increasing volume, these signals strengthen the outlook for $ROSE’s recovery phase, provided the token maintains price action above its recent breakout level.
Targets Indicate Potential for Sustained Uptrend
From recent technical reading, short-term target prices are located at levels of $0.01974, $0.02170, and $0.02329. These are located along the top border of the wedge and the 50-day Simple Moving Average (SMA50), which acts as a dynamic pivot point during early reversals phases. Holding ground above these levels would mean further strength in a recovery wave.
ZAYK Charts projects a near-term advance toward the $0.029–$0.030 range, representing a 5.5%–6% potential upside from the breakout point. This projection aligns with typical measured moves following clean trendline breaches, especially when supported by rising trading activity.
Holding structure above the breakout zone remains important in confirming the reversal of the trend. The wedge can consolidate once more if the price drops below $0.017. Nonetheless, the overall picture is a turning point higher in favor of the buyers, and it could be the start of a long-term uptrend for $ROSE as technical and momentum indicators remain bullish.