
- RAY has surged 50x since October but faces a major correction, testing crucial support at $4.50-$5.00.
- Technical indicators signal bearish momentum, with RSI at 38.56 and MACD showing downward pressure.
- A rebound could push RAY toward $6.50, while a breakdown may lead to $3.50-$4.00.
Raydium (RAY) has seen a substantial price movement in recent months, surging over 50 times since October. However, recent market conditions have led to a sharp decline, placing RAY at a crucial support zone. Investors are closely monitoring its price action to determine the next possible move.
A recent tweet from a prominent market analyst, Alpha Crypto Signal, highlighted RAY’s current price action, noting its strong rally since October and the recent correction testing key support levels. The tweet pointed out the importance of monitoring price movements closely.
Current Market Trends
RAY recently peaked near $9.00 before reversing into a correction phase. The price has dropped notably, testing an ascending trendline that has previously acted as a strong support level. This trendline is a critical juncture, as a breakdown below it could signal additional downward pressure.
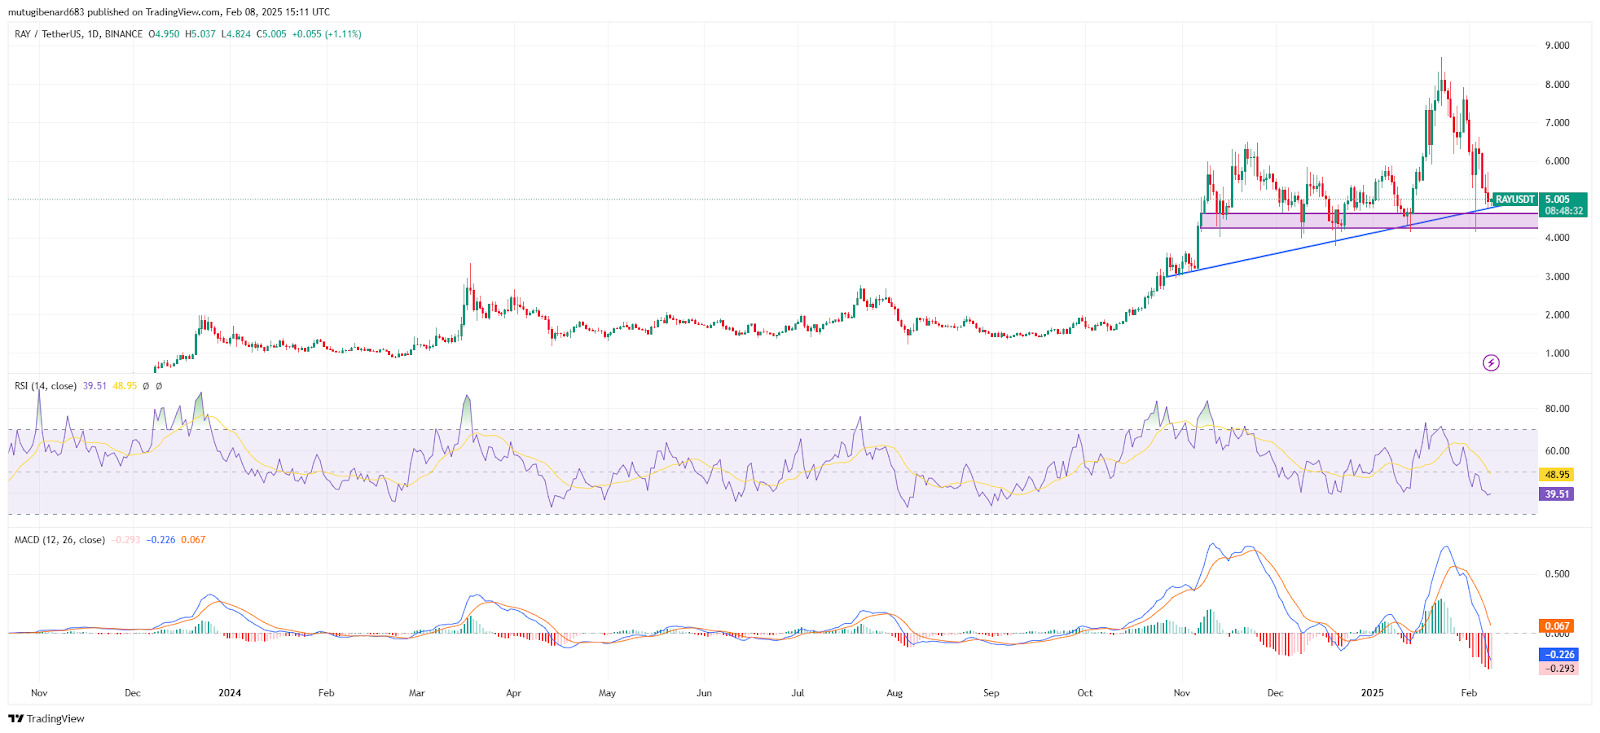
The horizontal support zone between $4.50 and $5.00 remains a key area of interest, as it aligns with previous consolidation phases where buyers have historically stepped in. A successful defense of this support could lead to a potential rebound.
Support and Resistance Levels
Key Support Zones
- $4.50-$5.00: A vital support level where buyers have previously shown interest. If this level holds, it may lead to a recovery.
- Ascending trendline (~$4.90): A crucial support level; a break below this could lead to increased selling pressure.
Resistance Levels
- $6.00 – $6.50: A short-term resistance area that was previously a support level.
- $8.00-$9.00: A major resistance zone where the last peak was recorded.
Technical Indicators
The Relative Strength Index (RSI) was at 38.56, which signifies a bearish trend. A fall below 30 can signify oversold levels, and oversold levels can reverse a price.
The Moving Average Convergence Divergence (MACD) line (-0.300) is also lower than its signal line (-0.235), a bearish momentum signal. The histogram even reveals red bars, a sign of continuing downtrend pressure.
Potential Market Situations
If RAY sustains its support at $4.50-$5.00, a reversal will push the price to $6.50. However, failure to hold its support will take the price to $3.50-$4.00.
At press time, RAY was at $4.89, having fallen 9.16% in 24-hour trading and 29.08% in a week. Participants in the market have not yet measured price actions in anticipation of buying cues.