
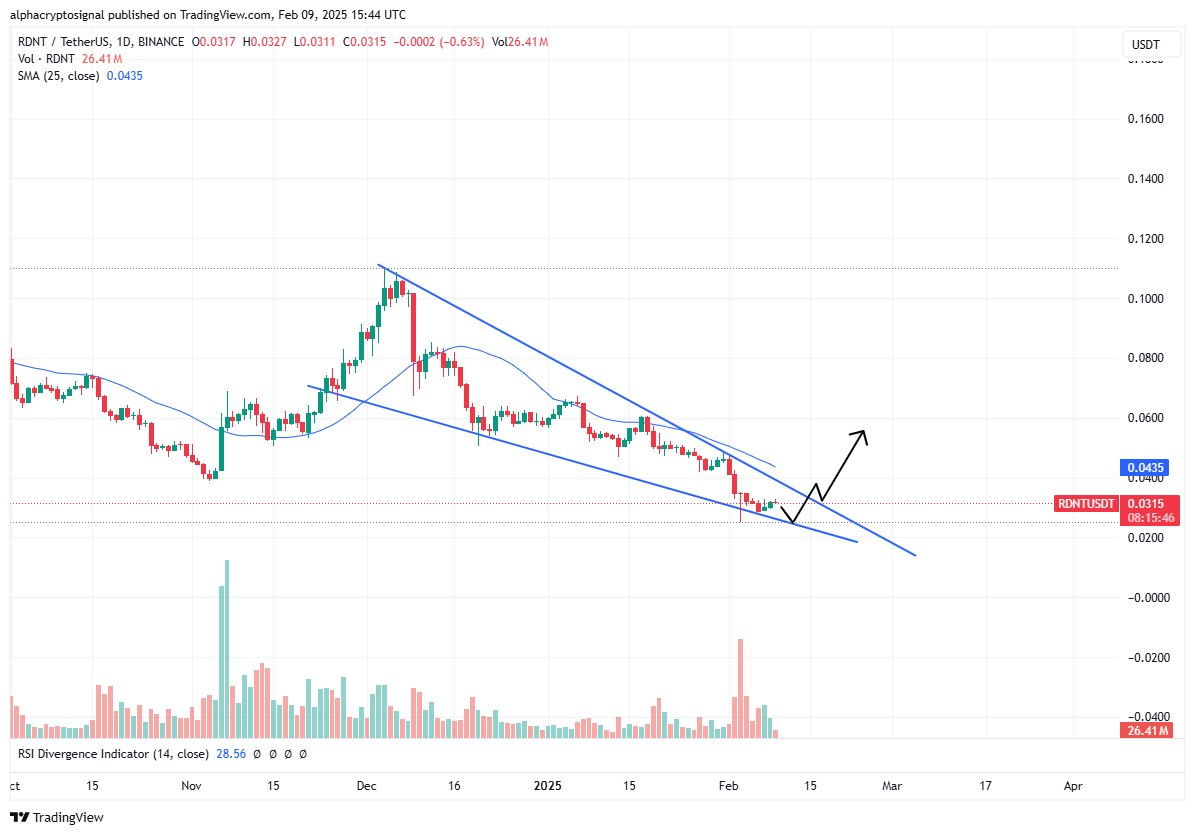
- A bullish breakout is indicated by the falling wedge pattern in RDNT while essential resistances sit at $0.0435 alongside support levels between $0.0300 to $0.0310.
- The RSI reading of 28.56 indicates oversold market conditions which increases the probability of an upward price move since selling intensity seems to decline.
- The market value of RDNT stands at $0.03276 while experiencing a 5.16% upward movement during the last day and demonstrating 2.89% growth over the past week.
A daily chart pattern of a falling wedge appears in Radiant Capital (RDNT), which indicates future potential bullish movement. This setup suggests a reduction in downward momentum, with market participants closely watching for confirmation of a breakout.

Technical Analysis of RDNT Price Movement
A recent post by Alpha Crypto Signal highlighted the ongoing formation of the falling wedge. The pattern consists of lower highs and lower lows, gradually converging. Historically, this formation often precedes a breakout to the upside once buying pressure increases.
Additionally, the Relative Strength Index (RSI) currently stands at 28.56, reflecting oversold conditions. Readings below 30 generally indicate that selling pressure is losing strength, increasing the probability of a price rebound in the near term.
Key Support and Resistance Levels
The market data indicates that buyers have established solid support at $0.0300 to $0.0310. Price fails to sustain this area and then meets its next important support spot at $0.0200. There exists a substantial resistance area stretching from $0.0400 to $0.0435 as it matches the position of the 25-day Simple Moving Average (SMA). A successful price movement above the identified range may trigger RDNT to move towards the mid-term targets between $0.0600 and $0.0800.
If RDNT breaks above the upper trendline of the wedge with strong volume, it could initiate a rally toward key resistance levels. Traders will be watching for an increase in volume and RSI recovery as confirmation signals.
A breakdown of price support levels would have RDNT falling to new lows until it attempts another rally. The future price movements of this asset will be decided in the following few sessions.
The price of RDNT stands at $0.03276 with a 5.16% rise in 24 hours alongside a 2.89% increase during the week.