- PUMP forms a tightening pattern as rising support and falling resistance shape market expectations.
- Volume declines sharply while the token posts small gains, signaling reduced participation.
- Traders examine a possible breakout after weeks of compression and repeated resistance tests.
PUMP continues to move within a narrow structure as traders examine a developing compression pattern and reduced market activity. The token shows brief upward movement while volume retreats and market sentiment shifts.
Compression Pattern Draws Attention
PUMP is approaching a key point in its structure, with traders monitoring a clean descending trendline paired with rising support. A chart shared by Yakuza (@Yakuza_Crypto_) presents this setup and is paired with the remark, “Tell me you didn’t just try to miss buying $PUMP here.” His comment reflects confidence in the pattern’s tightening shape, where lower highs meet higher lows.
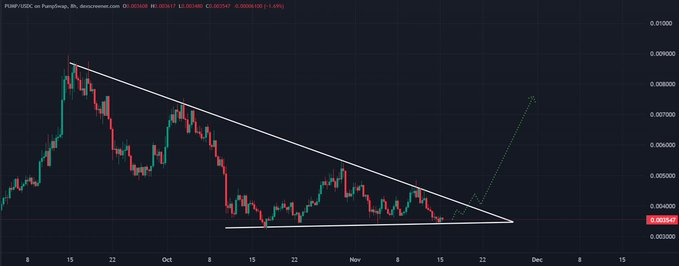
The formation has been visible since late September, with each rally attempt stopped beneath the declining trendline. Meanwhile, the ascending support shows steady buyer activity. Early November candles show repeated rejection wicks as price reacts quickly each time it touches the support base, signaling active accumulation.
Yakuza projects a potential breakout path, illustrated on his chart with a dotted trajectory toward the $0.006 to $0.007 region. That path depends on clearing the descending resistance that has held firm through several tests. The tightening range suggests that price is nearing the moment where expansion may occur.
Short-Term Growth Meets Declining Activity
PUMP as of writing trades around $0.003603 with a 2.37% gain in the past day. Although there is this positive trend, 24-hour trading volume declines by almost 48% to $183.1M. The movement indicates lightening effects and slowing efforts. Market value is $1.27B, and the fully diluted value is $3.6B.
The circulating supply is 354B PUMP of 1T. Holder numbers reach 111K, reflecting broad distribution with notable speculative presence. The chart shows alternating green and red periods, reflecting intraday volatility as sentiment shifts quickly between buyers and sellers.
Short-term gains stand against deeper long-range declines. The market maintains elevated volatility while lacking steady trend formation. This behavior continues to shape trading conditions across sessions.
Market Sentiment Builds as Traders Position for Movement
Long-short ratios on major exchanges lean toward buyers, with OKX showing a strong long bias at 2.32. This shift signals that traders expect a rebound as PUMP approaches its trendline. Long positioning also introduces potential liquidation risk if price turns lower.
Liquidation data shows balanced pressure within tight windows, while short liquidations rise during brief upward moves. This aligns with activity near ascending support, where buyers continue to defend levels.
A recent social update notes Pump.fun generating $39.1M in monthly revenue, indicating sustained platform usage. This continued activity keeps PUMP visible in the market as traders watch for confirmation of a breakout from the compression zone.