
- Polygon ($POL) has broken the key support level at $0.32, forming a descending triangle pattern that indicates a bearish trend moving lower.
- Current price action shows heavy selling pressure, with a 16.05 percent daily loss and bearish momentum confirmed by DMI and ADX readings.
- Key resistance now lies at the previous $0.32 support level, while zones at $0.17, $0.10, and $0.03–$0.05 serve as targets for declines.
Polygon ($POL) is experiencing mounting bearish pressure after breaking below a key support level. Technical chart patterns and momentum indicators suggest a sustained downtrend, potentially pushing the asset toward significantly lower price targets.
Technical Analysis of the Pattern
A recent tweet from crypto veteran Ali_charts confirmed the breakdown, noting that the pattern could target a move toward $0.041. The technical setup suggests that bearish conditions remain robust, prompting further sell-offs in the market
Technical charts reveal a descending triangle pattern, marked by lower highs and a descending trendline. A horizontal support level near $0.32 maintained price stability for many sessions before a recent breakdown occurred. Analysts note that such formations typically indicate further downward movement if bearish momentum persists.
Price Action and Momentum Indicators
At the time of writing, trading data shows POL trading at approximately $0.2376 with a 24-hour decline of 13.32 percent. The asset experienced a daily loss of 16.05 percent, reflecting heavy selling pressure. Volume surges during the breakdown support the bearish trend, confirming strong negative momentum in the market.
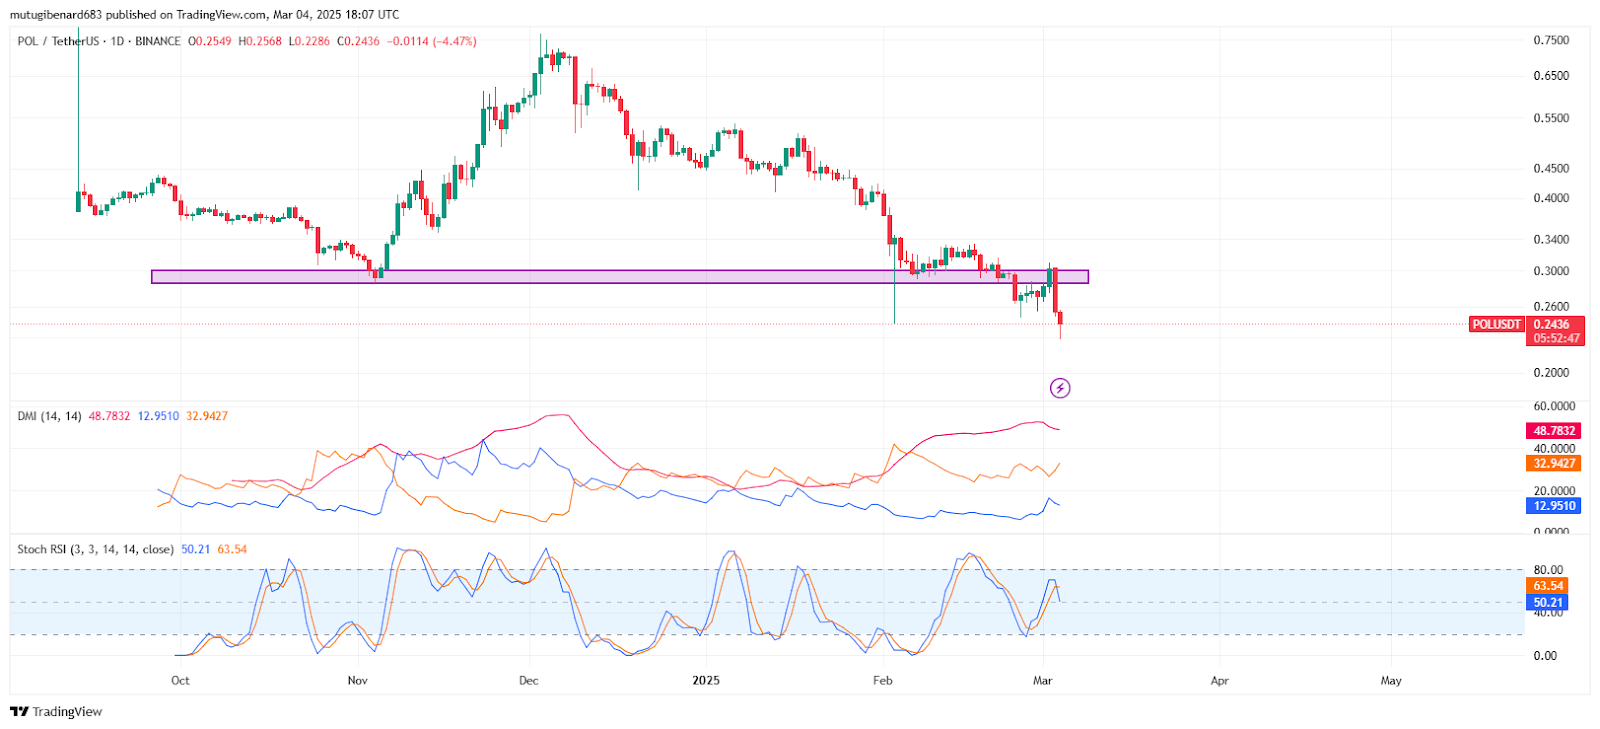
Momentum indicators reinforce the downtrend; the DMI shows dominant bearish pressure with -DI exceeding +DI. The ADX remains above 25, suggesting a strong trend, while the Stochastic RSI stays in a neutral range. Traders monitor these indicators closely to determine the continuation of the bearish momentum.
Key Levels and Future Projections
Resistance now lies at the previous support level of $0.32, which now acts as a barrier. Identified support zones include $0.17, $0.10, and potentially levels between $0.03 and $0.05. Market participants will monitor these key levels for signs of further downward movement or a possible retest.
Analysts expect a retest of the $0.32 level before additional declines occur. Volume and price trends will be crucial for confirming the bearish direction. Traders and investors remain cautious as they evaluate market signals for potential reversal or continued decline, and this careful analysis helps shape strategies in a volatile market.
Market participants will continue to evaluate these technical signals as Polygon navigates through the current bearish phase. The asset’s price movement remains under close scrutiny by investors and traders.