
- Polygon (MATIC) broke the $0.32 support level, confirming a descending triangle breakdown and extending its long-term bearish trend.
- The MACD indicator shows a bearish crossover, with a negative histogram, reinforcing the strong selling momentum and lack of bullish activity.
- The Directional Movement Index (DMI) indicates sellers remain in control as the price tests multi-year lows with weak buying pressure.
Polygon (MATIC) experienced a notable technical shift on March 18, 2025. The market witnessed a breakdown from a descending triangle pattern that has raised interest among analysts. This move adds to the ongoing discussion about the asset’s trend.
Technical Chart Analysis
The chart shows a clear descending triangle forming over a two-week timeframe. The long-term downtrend has been evident since the asset reached its peak. A horizontal support level near $0.32 was tested several times before the breakdown occurred. The recent tweet from crypto analyst Ali_charts noted, “#Polygon $POL makes its move! Breaking out of a descending triangle, targeting $0.040.” This remark brought attention to the technical setup.
The visual data confirms that price action has lost ground after failing to hold support. The formation signals that the downtrend continues to influence the asset. The chart details a wick reaching near $0.17 during a short recovery attempt. This formation suggests that the market could see further downward movement.
Price Action and Indicators
Price action confirms a steep decline below the $0.32 level. The price sits at approximately $0.20974 at the time of writing. The MACD shows a deep bearish crossover with the MACD line at -0.0748 below the signal line at -0.0539. The negative histogram bars further reinforce the downward trend.
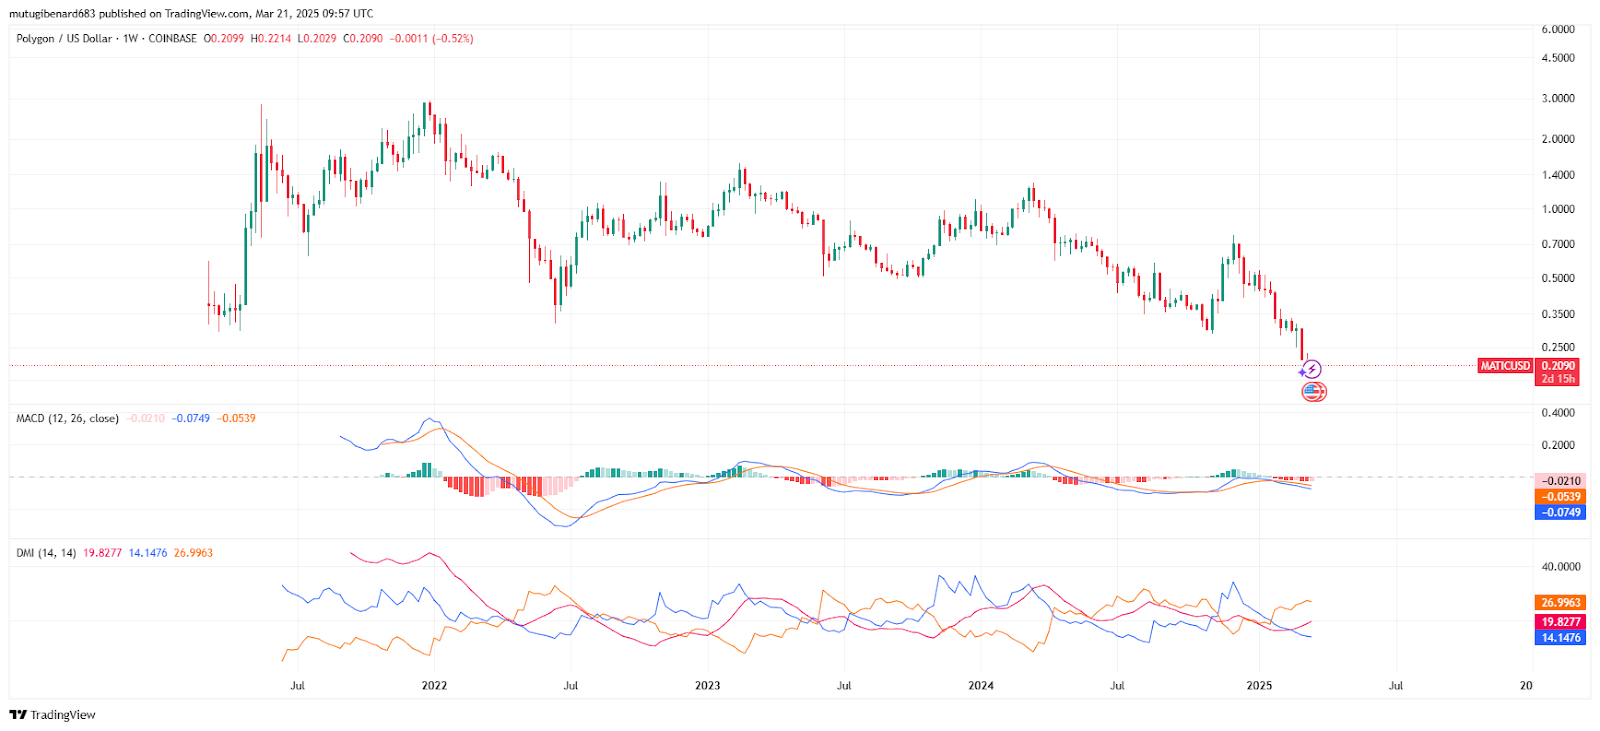
The Directional Movement Index (DMI) indicates that sellers maintain control over the market. The ADX value stands at 26.9963, supporting the view of a strong trend. The negative directional index remains above the positive directional index. This reading confirms that seller activity has dominated recent price action.
Market Trend and Future Levels
Price trends indicate that further losses could occur in the near term. The next major support appears to lie between $0.03 and $0.05. The technical structure supports the notion that a deep drop remains possible. The observed arrow on the chart points downward towards lower levels.
Current trading volume remains high as the market reacts to the breakdown. Recent figures show a 24-hour decline of 4.37% and a 7-day decline of 3.24%. Traders monitor these indicators closely, aware that a reversal requires a strong breakout above the descending trendline. The chart and technical readings continue to shape market expectations.