
- Pepe’s TD Sequential buy signal suggests a possible trend change if momentum continues, drawing attention from traders seeking bullish and higher entries.
- A bullish engulfing candle near 0.00000500 points to bargain buying, with observers anticipating further gains if resistance levels break and sustained momentum.
- Weakened MACD momentum and a Stochastic RSI crossover indicate improving conditions, though analysts await a firm breakout above 0.00000750 on daily charts.
Pepe has shown an 11.40% price increase over the past 24 hours, catching the attention of many market watchers. Despite this advance, the token remains down 6.21% across the previous week. Analysts are now evaluating short-term signals for a potential rebound.
Potential Rebound Indicators
A prominent analyst in the crypto space, Ali_charts, recently posted a chart revealing a buy signal from the TD Sequential indicator. This pattern often points to a possible shift in momentum when a nine-count sequence appears. Observers note that a smaller bullish candle followed a large bearish candle on March 10 and 11.
Such a formation suggests sellers may be weakening, although a firm confirmation is still pending. Traders look for follow-through candles to validate the potential reversal. Many see a break above immediate resistance levels as a positive sign for continued upside.
Technical Observations
Price data indicates a strong downtrend since November 2024, featuring lower highs and lower lows. A bullish engulfing candle near 0.00000500 may signal bargain buying or short covering. The MACD (12, 26) remains in negative territory but shows weakening momentum.
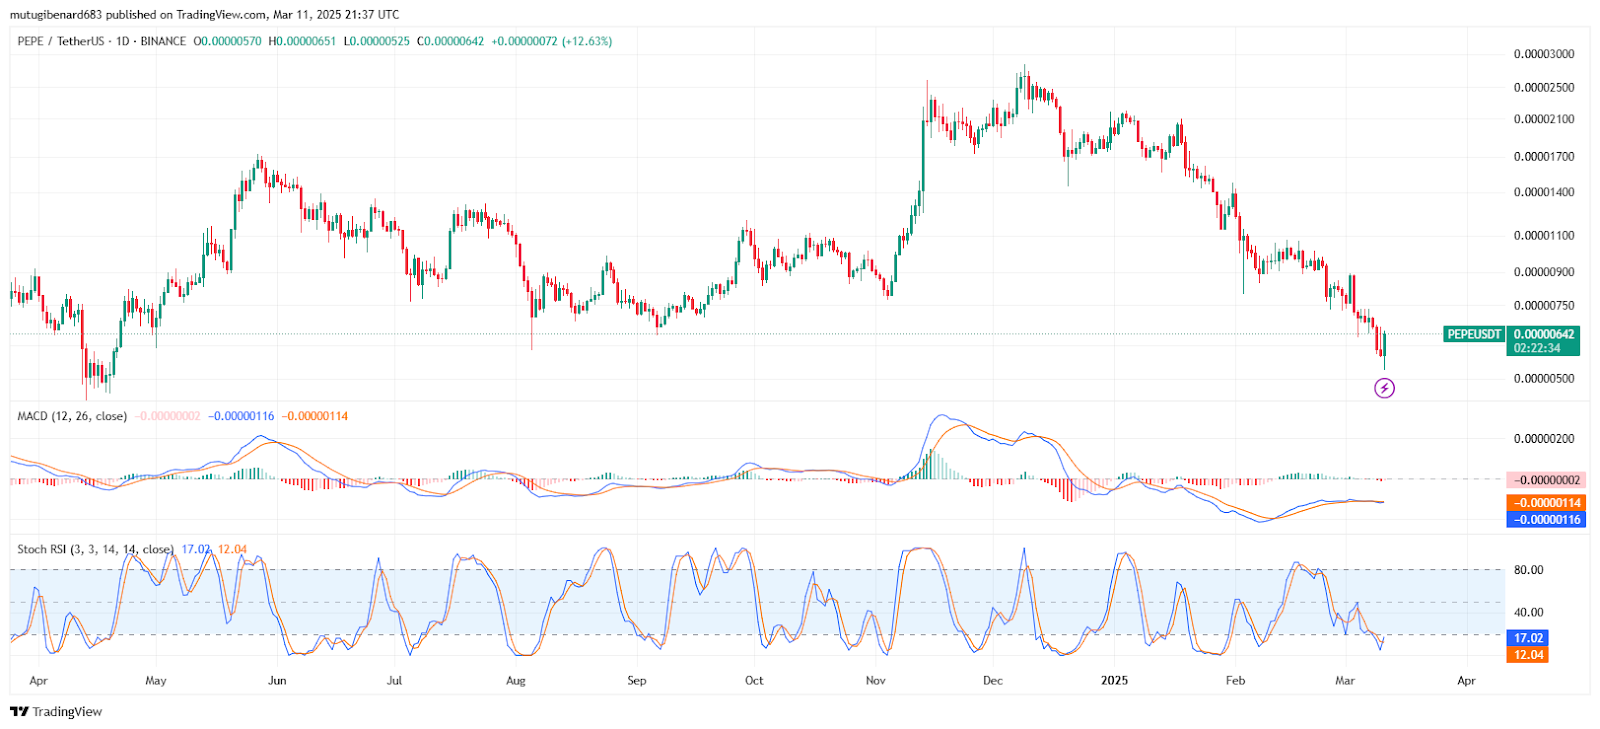
Additionally, the Stochastic RSI has crossed oversold territory, suggesting a short-term bounce may be underway. Analysts caution that momentum indicators alone may not confirm a trend shift without sufficient volume. Many are watching whether a bullish crossover develops in the MACD line.
Price Performance and Key Levels
Pepe was trading around $0.0000056475 at the time of writing, reflecting a robust 24-hour volume of $1,094,942,594. Observers believe a push above 0.00000620 could lead to testing 0.00000680–0.00000700. Some also highlight 0.00000750 as a critical resistance to overcome.
A failure to maintain recent gains might prompt a return to support near 0.00000525, extending the broader downtrend. Analysts note that confirmation of a sustained rebound would require stronger buying interest. Many remain attentive to potential breakouts that could shift overall sentiment.