
- PEPE is trading at the 0.618 Fibonacci at the price of $0.0000092, a major support zone that will determine its future price movement.
- A daily fall below $0.0000092 might produce a continuation of the decline, while a bounce might push PEPE to the resistance at $0.00001142 and higher.
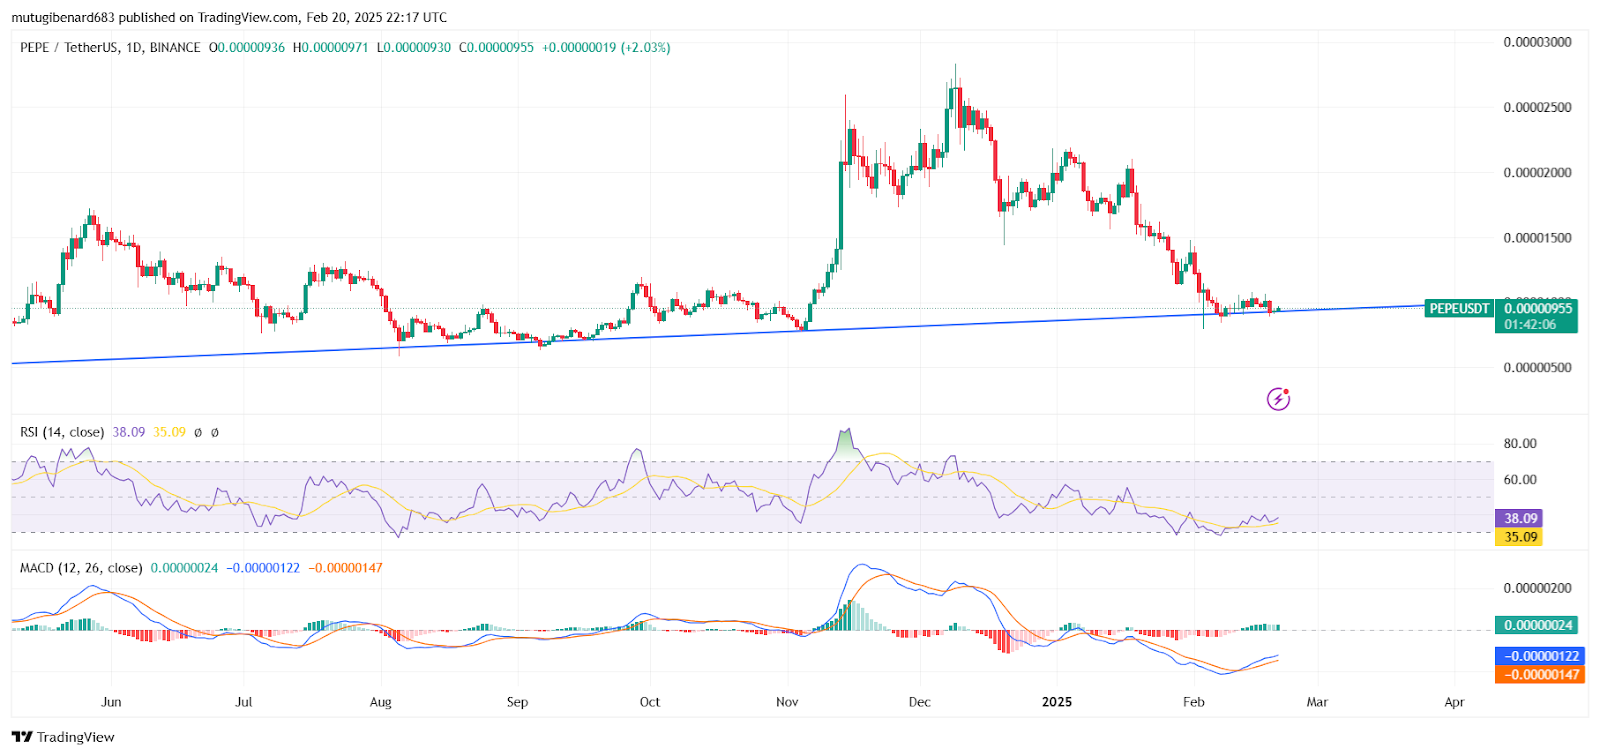
- RSI at 38.34 reflects negative momentum, although a bullish MACD cross and bounce back up to RSI 50 could indicate a turnabout.
The cryptocurrency market is highly volatile with traders closely following major patterns. With the change of market conditions, PEPE is at a crossroads testing major support levels that will likely define its immediate trend. Traders are following with a lot of interest if the asset can manage to hold ground or if downward movement is anticipated.
Analyst Opinion regarding PEPE’s Price Movement
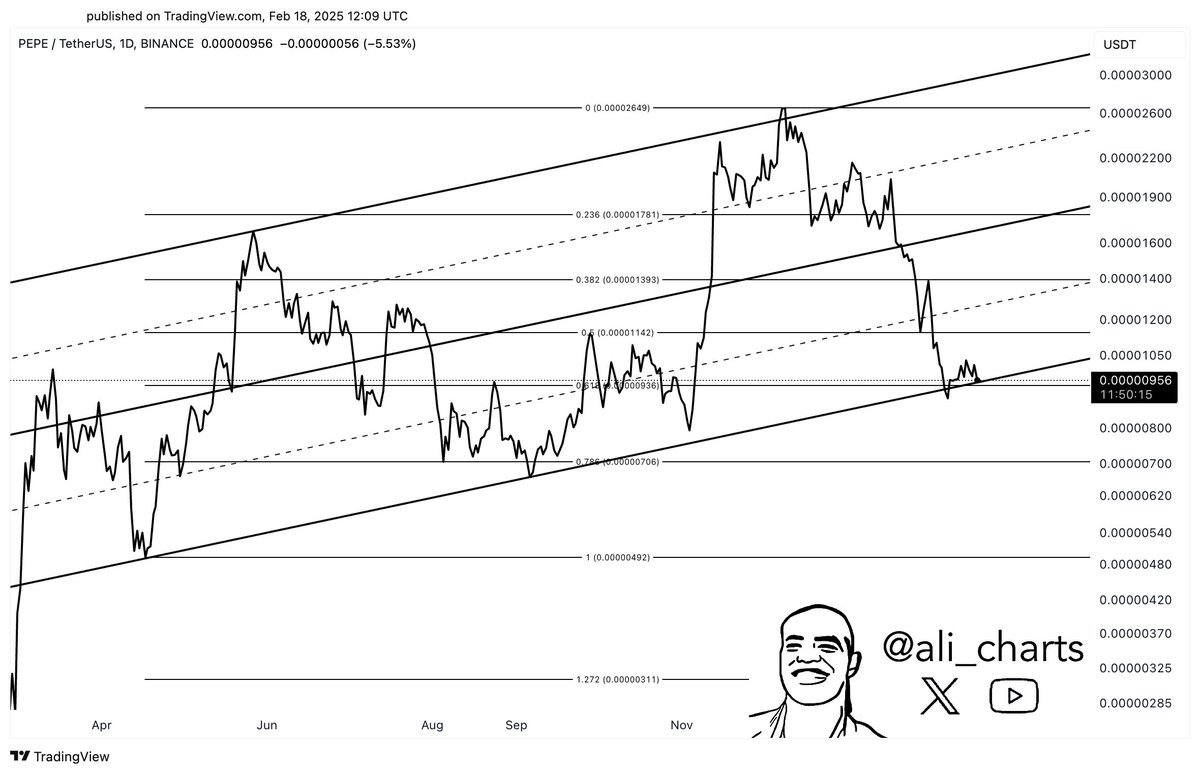
A recent crypto analysis by crypto commentator Ali_charts has fueled controversy regarding PEPE’s price movement. The commentator forecasts that if PEPE goes below the price of the daily chart at $0.0000092, then the price will go down to the price of $0.000031. Traders are following the forecast with the aim of major support levels.
At press time, PEPE was priced at about $0.00000956, up by 2.53%. It is also testing the 0.618 Fibonacci at a price of $0.00000936, a significant area that will likely determine its next movement. Technical analysts observe that remaining above this area will initiate a bounce while a break will lead to a continuation of the fall.
Key Price Levels and Trendline Analysis
On the upside, the resistance is at $0.00001142 (0.5 Fibonacci) and at $0.00001393 (0.382 Fibonacci). A breakout at these levels will indicate a turn to the bullish side with a target at higher prices. The previous high of $0.00002649 is a key long-term resistance price.
The ascending trendline, which has historically supported price movements, is being tested again. A successful hold at this level could provide buyers an opportunity to push the price upward. However, a failure to sustain this level could signal further declines, with increased sell pressure leading to lower support zones.
Momentum Indicators & Market Forecast
The Relative Strength Index (RSI) is 38.34 with weak momentum that can turn if the pressure to purchase grows. Crossing 50 on the RSI might indicate bullish strength. The MACD indicator is bearish with the MACD line below the signal line with diminishing bearish momentum.
Market analysts suggest that PEPE’s current support is dependent upon a change of momentum. If the MACD crosses bullish while the RSI rallies, PEPE could bounce back. If this is not the case, bearish pressure could lead to greater losses. It is implied by some market observers that if the support at the price of $0.0000092 is sustained, a bounce could lead to a retesting of the levels of resistance.
Potential Scenarios
A decisive break below the price of $0.0000092 could push PEPE to the levels of $0.00000800 or lower, representing further downward danger. It could initiate greater pressure to sell that could push the price to the lower Fibonacci levels of $0.00000492.
Conversely, reclaiming at $0.00001050 will signal renewed buying appetite. If the purchasing pressure is stepped up, PEPE can aim at $0.00001300 and beyond. It is observed by experts that a break at $0.00001393 will signal bullish strength that can lead to a trend towards the uptrend trendline.