
- PENGU has tested the $0.0106 channel boundary three times, with Ali Charts watching for another breakout attempt.
- A decisive move above $0.0106 could put $0.0153 in focus, while Pudgy Penguins’ Korea Blockchain Week activity may add attention.
- PENGU trades near $0.0094 with $0.0090 support, while weakening RSI and MACD keep 0.0080-0.0070 as downside levels.
PENGU is testing a key resistance level after recovering from its mid-September low, while analyst Ali Charts anticipates another breakout attempt. The analyst said the token has tested the upper channel boundary at $0.0106 three times. Ali also pointed to Pudgy Penguins’ activities at Korea Blockchain Week as a potential catalyst for renewed market interest.
Ali Charts Highlights Repeated Resistance Tests
According to Ali Charts, PENGU has made three attempts to break above the channel’s upper boundary at $0.0106. The analyst said repeated tests could weaken the resistance level, potentially allowing price to move higher.
Ali identified $0.0153 as a potential target if PENGU decisively breaks above $0.0106. The analyst also described current prices as a possible accumulation opportunity, although this reflects Ali’s assessment rather than a confirmed market outcome.
Meanwhile, Pudgy Penguins is making a major push at Korea Blockchain Week. Ali cited the event as a possible fundamental catalyst that could support another breakout attempt.
PENGU Pulls Back After September Rally
PENGU’s four-hour chart shows a recovery from approximately 0.0068–0.0070 on September 16. The token subsequently rallied toward 0.0100–0.0110, with trading volume expanding notably between September 22 and 24.
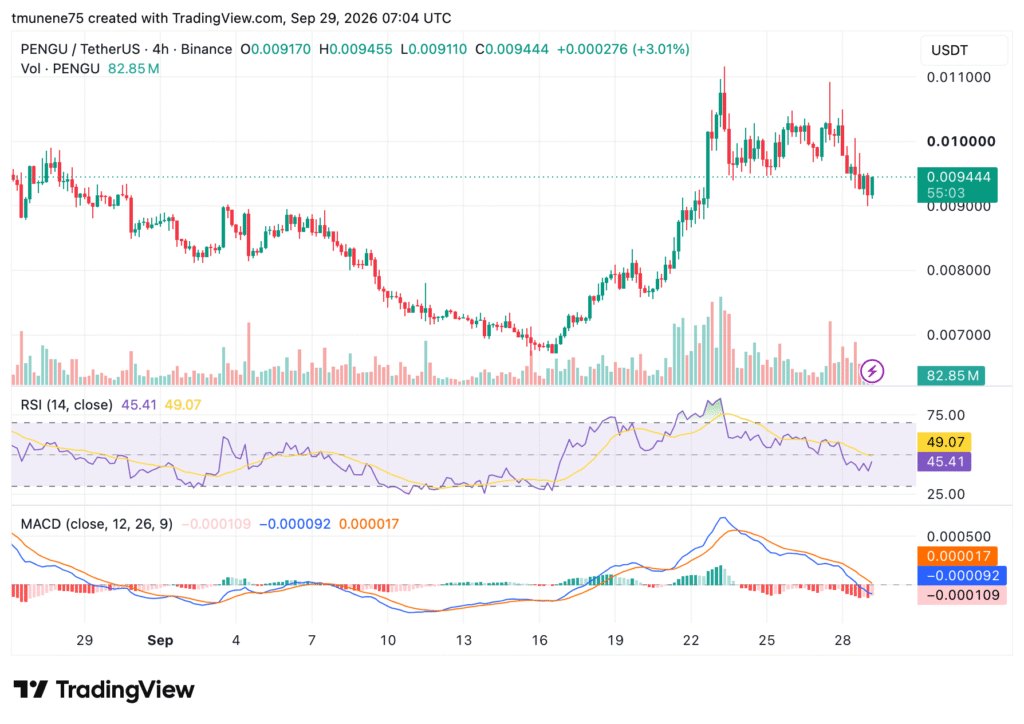
However, PENGU failed to sustain its move above $0.0110 and then formed lower highs. The price retreated toward $0.0090 before reaching $0.009444, with the latest candle gaining 3.01%.
The $0.0090 level now represents near-term support. A sustained move above $0.0100 could bring the 0.0105–0.0110 resistance range back into focus.
Momentum Indicators Show Short-Term Weakness
PENGU’s Relative Strength Index is at 45.41, below its average of 49.07. The reading remains above the oversold threshold of 25, although momentum is below the neutral 50 level.
The MACD also reflects weakening momentum, with its line at -0.000092 and signal line at 0.000017. Its histogram is negative at -0.000109, indicating bearish short-term momentum.
Holding above $0.0090 could allow PENGU to consolidate and retest $0.0100. However, a break below support could expose $0.0080, followed by the $0.0070 region.