
- Optimism (OP) confirms the underlying buying divergence and rising volume, suggesting investors’ buying and the potential for strong breakout.
- OP has rallied back from the strong support level around $1.05-$1.10, the levels of resistance being $1.20 and $1.30, showing the continuation of the rally.
- Technical indicators, including MACD and RSI, show bullish momentum building, with analysts forecasting a 300% price increase toward $4.86.
Optimism (OP) prints strong buy signals after forming latent buy divergence patterns. An explosion of buying volume signals heavy investors adding their holdings, possibly causing a massive rise in price. Experts estimate the rise potential for around 300%. The price levels for this rise were around $4.86.
Market Analysis and Investor Interest
According to the tweet by JavonTM1, OP has demonstrated strength through latent bullish divergence and increased volume, implying the potential for upside. Market analysts also indicate the double-bottom formation where the second dip has witnessed the establishment of a higher low. This formation coupled with the increased levels of the Relative Strength Index (RSI) implies reduced selling pressure.
Trading volume has expanded around support levels. A sharp spike from recent lows suggests institutional investors may be accumulating their holdings, boosting the likelihood for the breakout in price.
Key Resistance and Support Levels
OP has also broken the historical descending trend line. Strong support is also seen around $1.05-$1.10, where the price has bounced multiple times. If this support is maintained, the next levels of resistance worth keeping close watch for will be $1.20 and $1.30.
A breakout over $1.30 could start the next leg up, and potential targets could be around $1.50. Analysts believe the rally will continue, and OP could make its way all the way back up to $4.86, up by 300% from here.
Technical Indicators Suggest Uptrend
Momentum indicators portray the change in market conditions. The MACD indicator has also formed a bullish crossover, where the MACD line has gone over the signal line. Besides, the MACD histogram has also turned from red to green, implying decreased selling pressure.
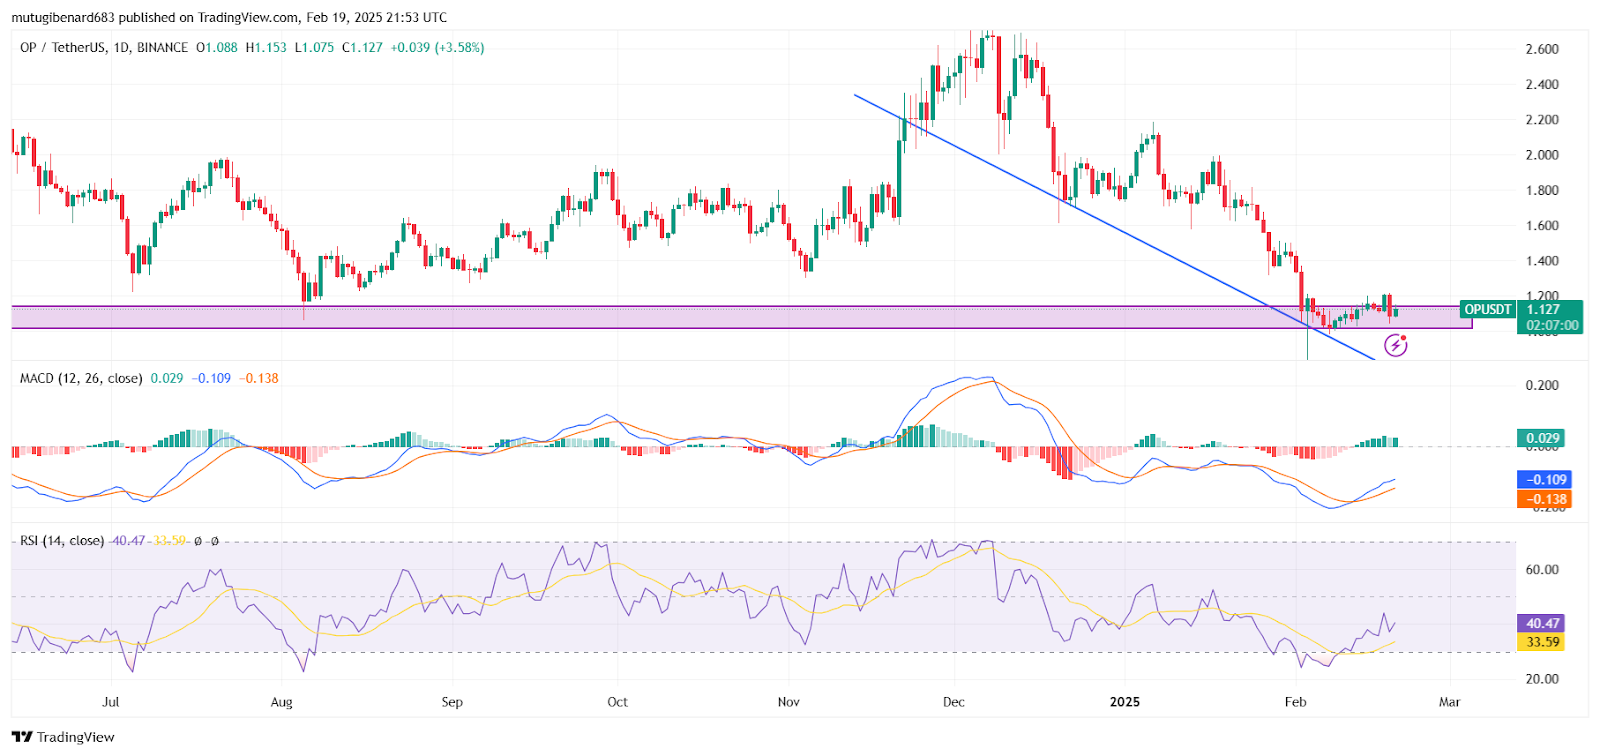
The RSI, while still under the middle-of-the-road level of 50, has bounced from being overbought and is rising. If the RSI crosses over the level of 50, the momentum could build even stronger.
Traders are now waiting for OP to hold onto the support levels and confirm the breakout through $1.30. OP is trading at $1.14 at the time of writing, up by 6.60% over the last 24 hours, and has a trading value of $161,002,930.