
- The TD Sequential indicator has flashed its buy signal, suggesting that ONDO can possibly undergo trend turnaround.
- ONDO is around its key support range of $1.25–$1.27, while its resistance is around $1.32–$1.35 on its 4-hour chart.
- The MACD indicator is signaling waning bearish momentum, and a bearish crossover can confirm a move up to $1.45–$1.50
ONDO has had its downtrend of late but is signaled by technical measures to turn around. The TD Sequential indicator has generated a buy signal on its 4-hour chart, indicating that there is likely to be a turnaround on the horizon. While ONDO’s price had fallen by 1.75% over the last seven days, it had risen by 1.16% over the last 24-hour period, trading at $1.28 during press time.

Crypto analyst Ali noticed this trend earlier on, commenting that ONDO is set to bounce after its buy signal flashed on the TD Sequential indicator. The observation is also confirmed by recent market trends and chart formations that indicate possible upswings.
Price Action and Technical Structure
The chart depicts an extended bear trend with a succession of red candlesticks pointing to intense selling force. A green “S13” indicator has appeared, possibly indicating that there is a buy point here. The price movement afterwards has depicted consolidation, indicating that there is a balance of buyers versus sellers. A big white candlestick has appeared, making its move through levels of resistance.
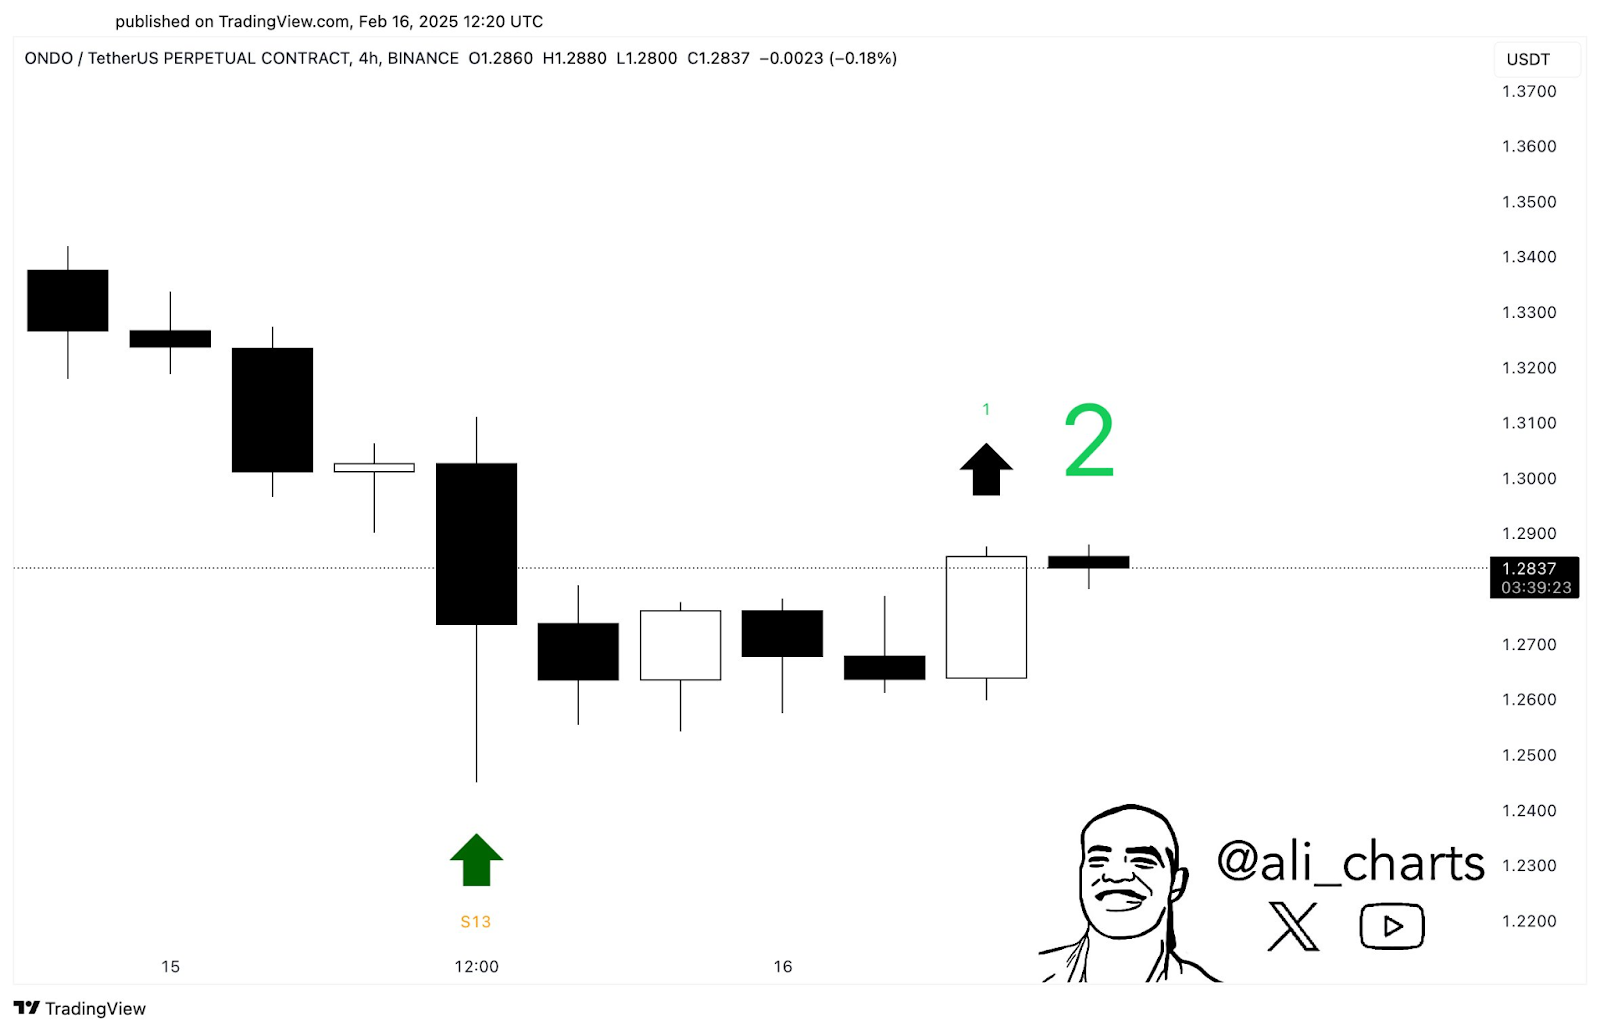
Annotations on the chart also reinforce this potential shift. A likely breakdown pattern is shown by a black up arrow labeled “1” and a green “2.” The price is hovering around resistance but is pointing to increasing market interest in ONDO by its bullish candle.
Support, Resistance, and MACD Analysis
ONDO is hovering around its strong supporting range of $1.25 to $1.27. The same has been supported on many occasions, suggesting good demand on dips. The resistance is around levels of $1.32 to $1.35, marked by a downtrend line. The price can move up to levels of $1.45 to $1.50 if broken.
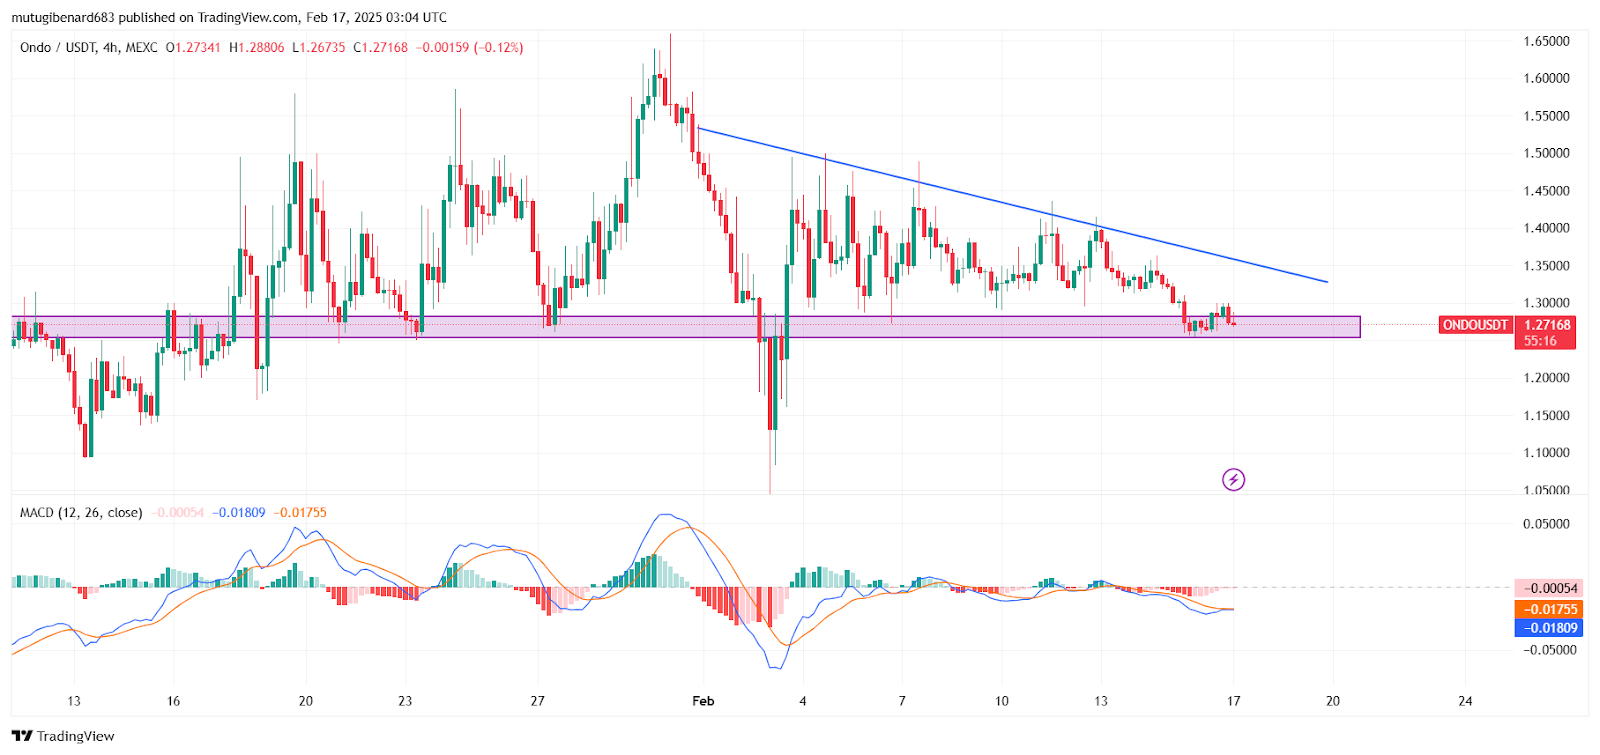
The MACD indicator is signaling trend change. The signal line is converging on the MACD line, while the histogram is fluctuating around zero. A confirmed buy signal can mean building demand pressure and maybe a rally.
Potential Trading Scenarios
If the support of $1.25 to $1.27 is held, ONDO can advance up to downtrend resistance of $1.32 to $1.35 levels. A break of this point will consolidate the bullish sentiment and make room for further rises. But if support is breached, the price can decline to $1.20 or lower levels. Higher volume combined with bearish candle closing below $1.25 will consolidate this bearish outlook.