
- Monero’s red “9” signal on the TD Sequential indicator points to a potential short-term reversal following a significant downtrend, marking buyer interest.
- Technical analysis reveals support at $205–$208 and resistance near $215–$220, guiding traders in setting precise entry points for potential upward momentum.
- The daily chart displays a clear horizontal line near the mid-$200 range, with the Stochastic RSI and DMI confirming active buyer strength.
Monero (XMR) is drawing attention after a noted analyst signaled a possible price reversal. The cryptocurrency has hovered near a key support area, and traders remain watchful as momentum indicators reflect potential shifts in short-term trends.

TD Sequential Indicator and Recent Downtrend
Crypto enthusiast Ali Martinez posted that the TD Sequential indicator has printed a red “9” on the 3-day chart. This observation followed a stretch of bearish candlesticks, with Monero dropping from above $240 to near $205.
Traders often regard this signal as a clue that selling pressure may be easing. Market participants are evaluating whether this setup can spark a short-term bounce, especially if the price maintains support around $205.
The three-day chart aligns with these observations by presenting a red “9” count from the TD Sequential tool. This setup typically warns that sellers may be reaching exhaustion, opening the door for a potential upswing.
Key Support Levels and Recent Price Action
Technical analysis pinpoints a support zone at $205–$208, where the market has repeatedly rejected lower prices. Monero has bounced near this line, showing that buyers are active in this region.
At the time of writing, Monero was priced at $217.60, reflecting a 1.74% gain over the past 24 hours. However, the seven-day change remains negative at -7.66%, which shows ongoing caution among traders.
If Monero overcomes the $215–$220 range, traders anticipate a move toward $226 or higher. On the other hand, failure to maintain $205 could trigger a drop toward $200 or even lower levels.
Momentum Indicators and Chart Observations
The daily chart reveals a prominent horizontal line near the mid-$200 zone, where recent candlesticks indicate a possible turning point. Stochastic RSI sits in oversold territory, suggesting that buyers may enter if momentum strengthens.
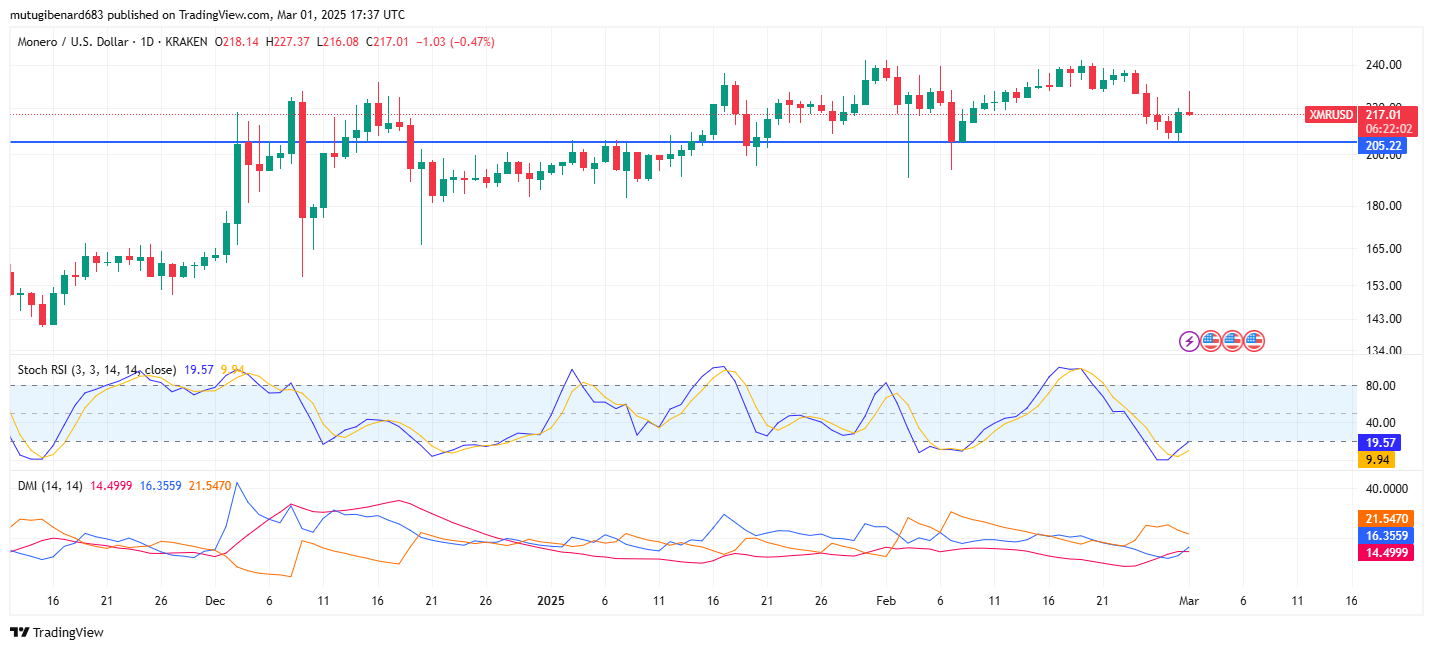
The DMI panel shows the +DI above the –DI, although the gap is not wide. Traders watch for any crossover that might signal a deeper decline or confirm renewed upward pressure.
Market watchers point to the repeated tests of the mid-$200 zone as evidence of a sensitive region. If momentum gains strength, Monero may seek higher ground, but a renewed sell-off remains possible if conditions weaken.