

- MantraDAO (OM) surged past $7.70 but now faces resistance, with potential movement toward $8.50 or a pullback to support levels.
- Bollinger Bands show OM trading near the upper band, while Stochastic RSI remains in overbought territory, signaling possible short-term weakness.
- If OM holds above $7.76, further gains could follow. However, failure to break resistance may lead to a pullback toward $7.20 or $6.25.
MantraDAO (OM) has surged by 530% since October, recently hitting strong resistance at $8.00 after breaking past key levels. The price movement suggests possible consolidation or a pullback, as technical indicators signal overbought conditions. Traders closely monitor whether OM will sustain its bullish momentum or retrace in the short term.
Price Action and Market Trends
OM’s price recently broke out from the $6.25 support level, surpassing $7.70 before entering a consolidation phase. A strong bullish rally, driven by high volume, pushed the price upwards, forming vertical green candles. The price currently tests resistance at $7.70-$8.00, a key level determining the next move.
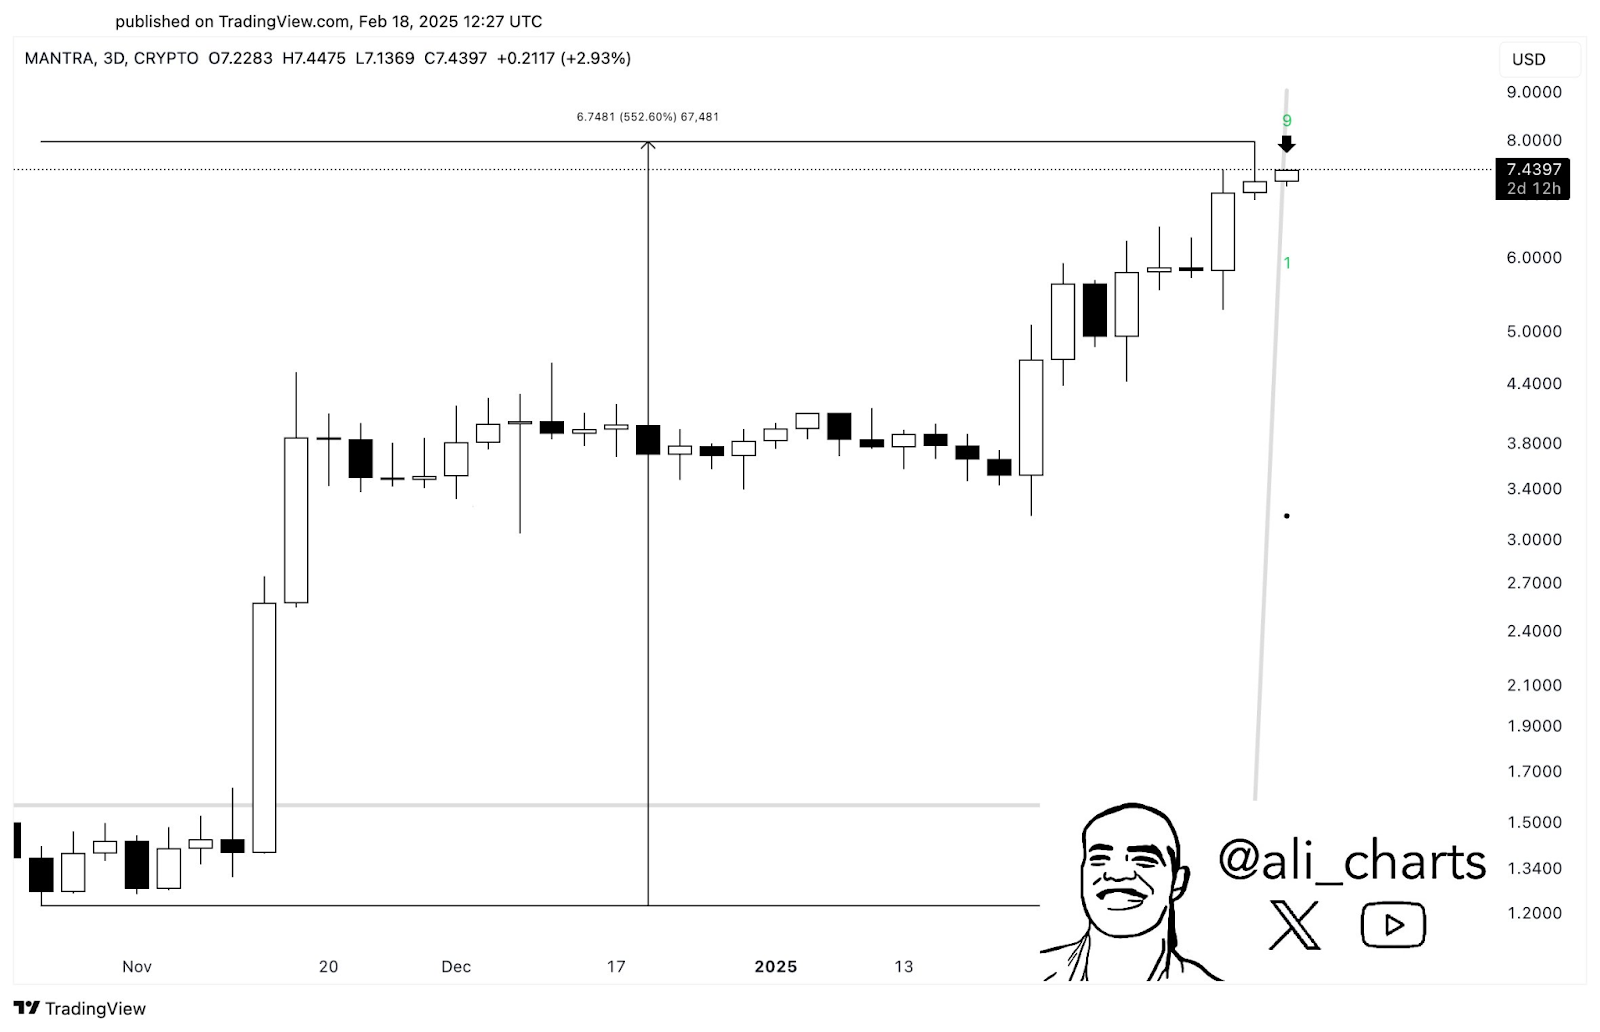
Source: Ali Charts
A recent tweet by ali_charts notes that the TD Sequential indicator signals a sell setup on the 3-day chart. If OM successfully breaks above $7.76, the next resistance stands at $8.50. Conversely, failure to breach this zone could lead to a retracement toward lower support levels.
Technical Indicator Analysis
Bollinger Bands indicate that OM is trading near the upper band at $7.77, suggesting an overbought condition. The middle band, around $7.45, serves as immediate support, while the lower band at $7.20 could act as a secondary support if a downturn occurs.
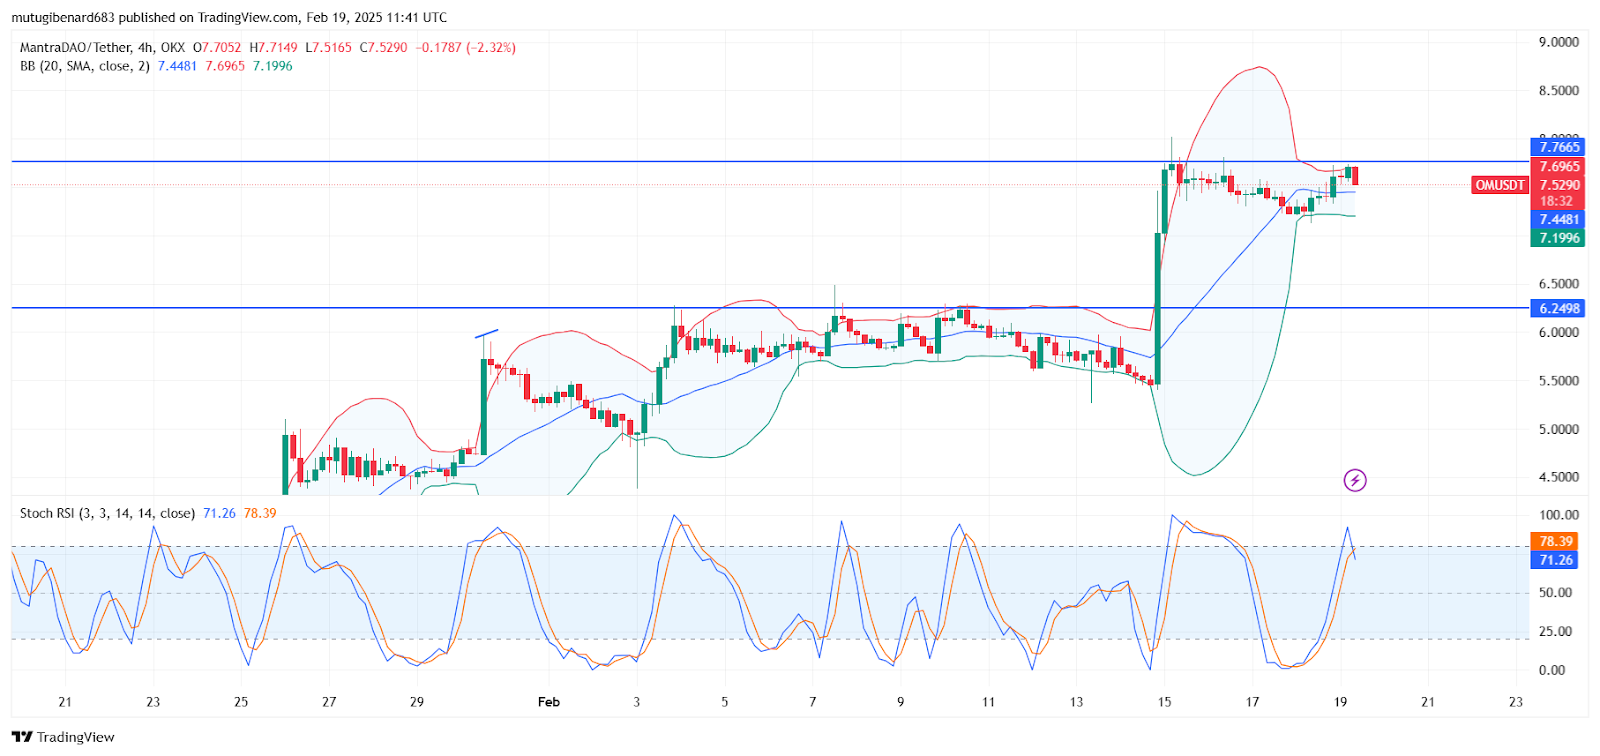
The Stochastic RSI is above 80, signaling overbought market conditions. The blue and orange lines, at 79.82 and 81.24 respectively, show that a downward crossover might lead to short-term price weakness. Traders are watching for a potential cooling-off phase that could bring OM toward support levels.
Key Levels and Potential Scenarios
Resistance Levels:
- $7.70 – $8.00: Immediate resistance zone currently being tested
- $8.50: Next major resistance if the breakout continues
Support Levels:
- $7.45: Middle Bollinger Band acting as dynamic support
- $7.20: Lower Bollinger Band support area
- $6.25: A critical historical support level
If OM breaks and holds above $8.00, price movement could drive values toward $8.50. However, a rejection at this level and a close below $7.45 might trigger a pullback toward $7.20 or $6.25. Market participants are advised to track volume and price action for confirmation of the next move.
The price of OM was at $7.59 at the time of writing with a 2.29% growth within 24 hours while demonstrating a 28.69% increase during the past week. Market participants observe the market carefully because it is deciding its future path.