
- The TD Sequential indicator suggests a potential bullish reversal for $OM after a prolonged downtrend, signaling price exhaustion.
- A falling wedge pattern on the 4-hour chart hints at declining volatility, with a possible breakout that could push $OM toward $8.50.
- $OM’s key levels: $6.00 support and $6.80 resistance. A confirmed breakout above the wedge could trigger a 30-40% price surge.
The TD Sequential indicator has recently flashed a buy signal for Mantra ($OM) on its daily chart, suggesting a potential bottom. Ali highlighted this development, pointing out that the indicator could signify a shift from the prolonged bearish trend. The OM/USDT perpetual contract on Binance, tracked from February 21 to March 11, 2025, shows this price action.
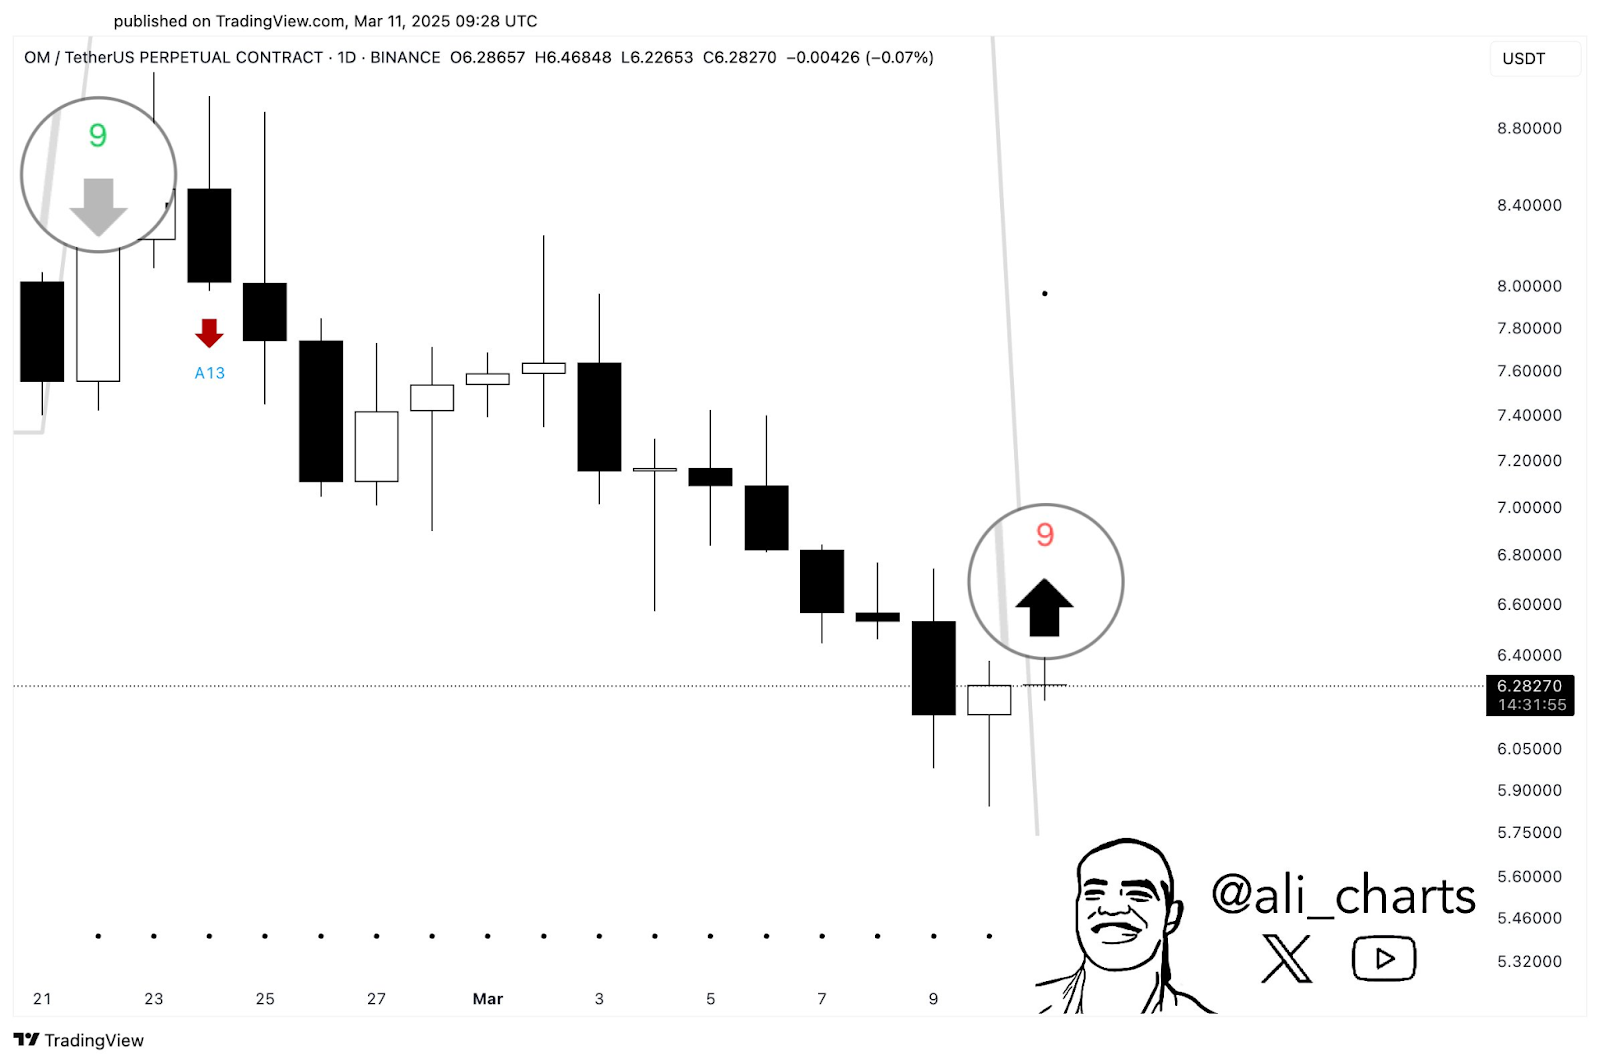
TD Sequential Indicator Hints at Potential Reversal
On February 27, the chart displayed a strong bearish signal with the appearance of an “A13” marker, indicating continued downward pressure. The price peaked near $8.80 before starting its descent. By March 10, a “9” count surfaced alongside a black upward arrow. This marker often signals a potential trend reversal or price exhaustion. During this period, the price hovered around $6.28, slightly above the earlier low.
The chart also identifies a defined support level at $6.00. This level became evident from price consolidations in early March. Resistance formed near $6.80, where previous bullish attempts failed. Although the price is currently slightly above the support zone, indecisiveness dominates. Notably, volume data is absent, limiting deeper insights into trade strength.
Falling Wedge Pattern Suggests Bullish Momentum
Adding to the bullish narrative, World Of Charts identified a falling wedge pattern on the 4-hour chart. This technical setup, visible from February 5 to March 11, indicates declining volatility and contraction within converging trendlines. The upper trendline marks lower highs, while the lower trendline tracks lower lows.
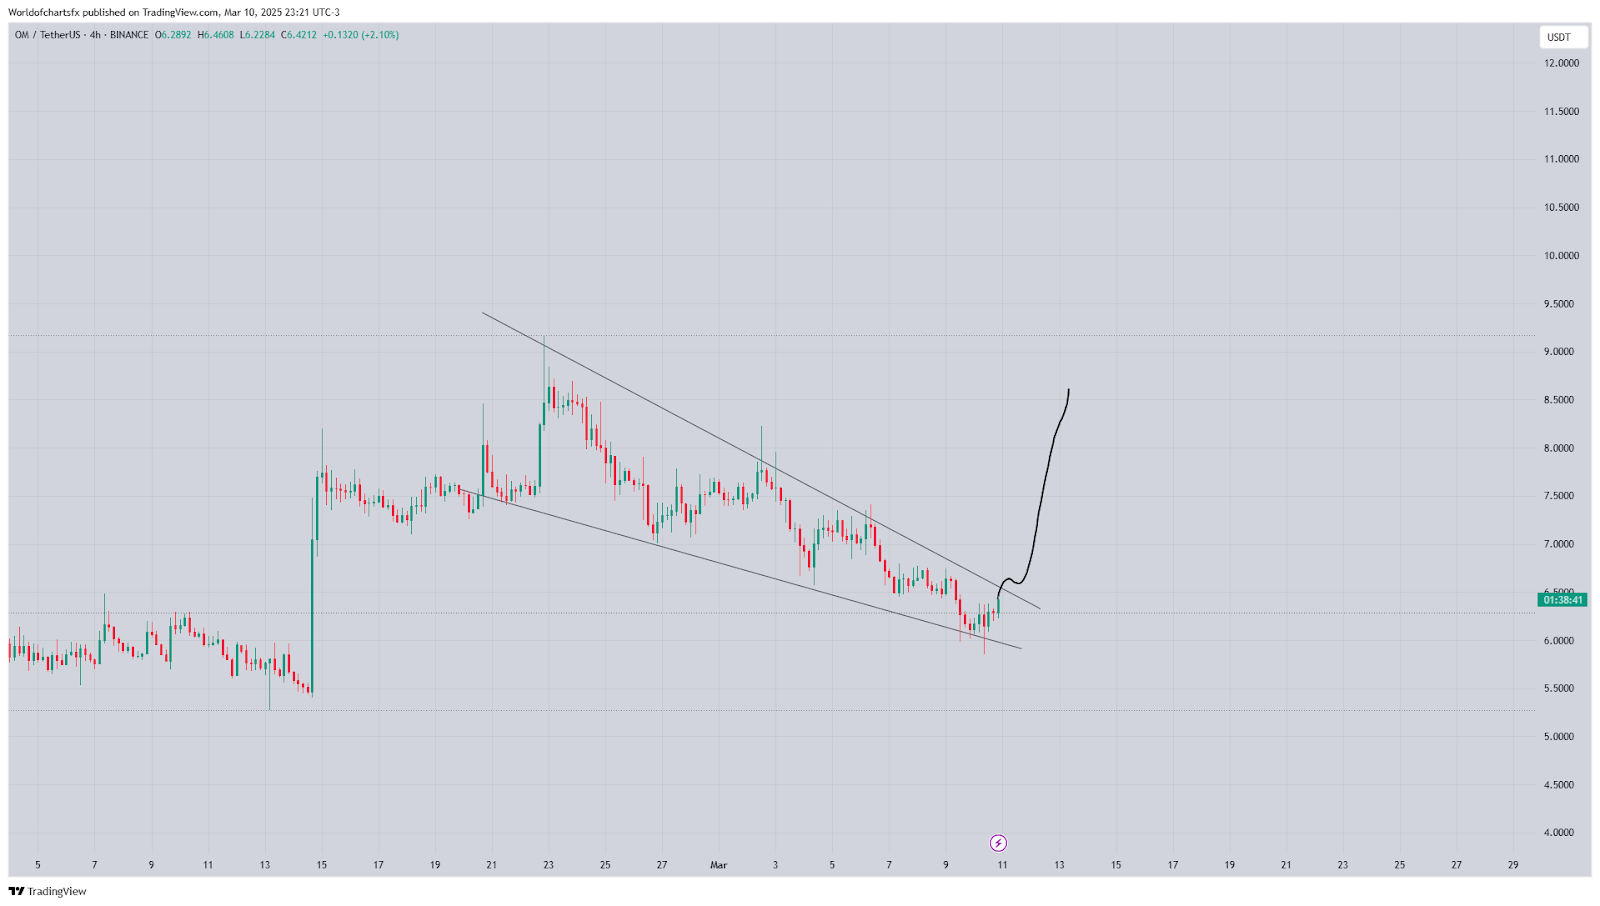
The price reached its lowest boundary near $6.00 around March 10. However, a breakout attempt is now visible, with the price slightly recovering to $6.42. A black curved arrow illustrates a potential sharp upward movement, signaling optimism for a breakout. If the price successfully breaches the upper trendline, it could rally by 30-40%, potentially targeting $8.50 or higher.
Currently, the price is testing the upper resistance of the wedge. A breakout above this level could confirm bullish momentum. However, failure to do so may lead to further consolidation. Traders should closely monitor these key levels for confirmation.