
- The symmetrical triangle’s upper trendline faces LTC for its third test which shows decreasing resistance with possible breakout power.
- Weekly price action displays bullish volume spikes and moving average crossovers and fresh momentum above $100 while breakout pressure builds up.
- Volume profile reveals thin resistance above current levels, setting the stage for a sharp upside move if the breakout confirms this time.
Litecoin (LTC) is approaching a vital resistance zone which could lead to a breakout following multiple years of price consolidation. The weekly chart reveals bullish indicators together with price action momentum indicating potential renewed market strength.

Symmetrical Triangle Structure Nearing Resolution
CryptoBullet noted that LTC is retesting the upper boundary of a symmetrical triangle pattern that has developed over seven years. The structure consists of a descending resistance and ascending support, compressing price into a tightening range. Historically, such patterns often resolve in the direction of the prevailing momentum.
As of writing, Litecoin is trading around $115, approaching the resistance zone between $130 and $150. This marks the third retest of this zone since 2021, each weakening resistance strength over time. Beneath this structure lies a major Point of Control (POC) between $60 and $70, which reflects a high-volume accumulation area—often seen as a base for bullish continuation.
Volume profile data shows declining resistance above the current price, suggesting that a breakout could be followed by rapid price expansion. Fibonacci extension levels indicate a potential upside to $295 and $650, should the move gain traction.
Technical Indicators Support Uptrend Momentum
The bullish view receives additional backing from the positive momentum indicators. Litecoin surpassed both the 9-week and 21 week moving averages recently and confirmed a bullish crossover.This moving average alignment is typically viewed as a medium-term trend reversal signal.
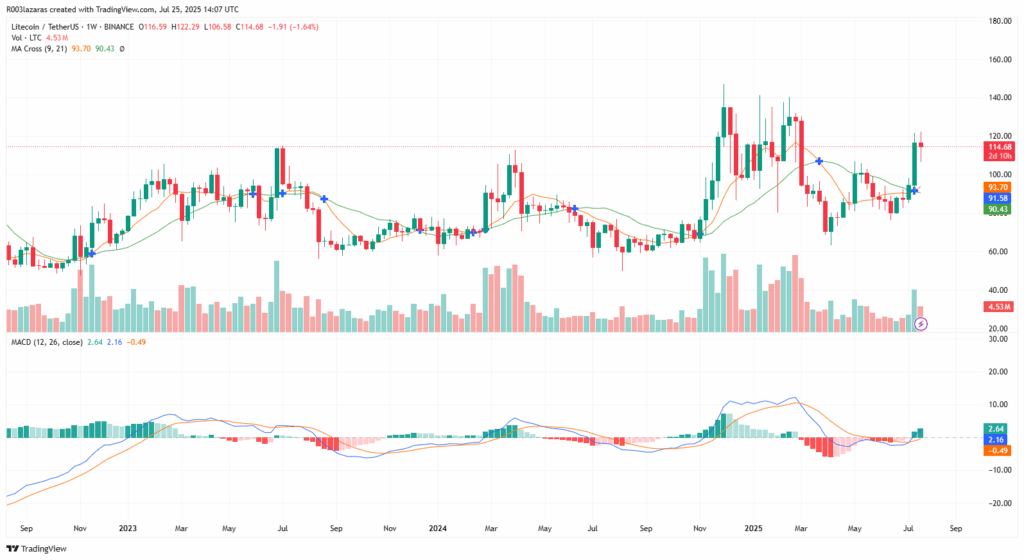
The MACD (Moving Average Convergence Divergence) indicator has also printed a bullish crossover for the first time since early 2025. Rising green histogram bars point to increasing bullish momentum. These signals collectively indicate growing interest and buying pressure behind the current price movement.
A notable volume spike of 4.4 million during the recent breakout adds weight to this trend, reflecting increased market participation. This is the highest volume seen in months, which often precedes larger directional moves.
Key Price Levels and Market Structure
The current LTC trading above \$100 psychological level means this zone has transformed into immediate support. A continued trading pattern above \$115 will increase the likelihood of reaching the next resistance levels at \$130 and \$140..
The long-term resistance area remains near $150. Should LTC close multiple weekly candles above this zone, the symmetrical triangle structure will likely resolve upward. That scenario could open doors to larger gains in the medium term.
Traders are closely monitoring weekly candle closings and volume behavior as confirmation signals. With momentum building and historical compression nearing its endpoint, the current setup suggests Litecoin may be entering a new price phase.