
- Ali’s tweet underscores Litecoin’s importance of holding above $98, suggesting that sustained support can drive a rally toward the $135 resistance zone.
- Moon Whales indicates that a strong bounce from the ascending trendline may propel Litecoin toward higher targets, reinforcing strength and market momentum.
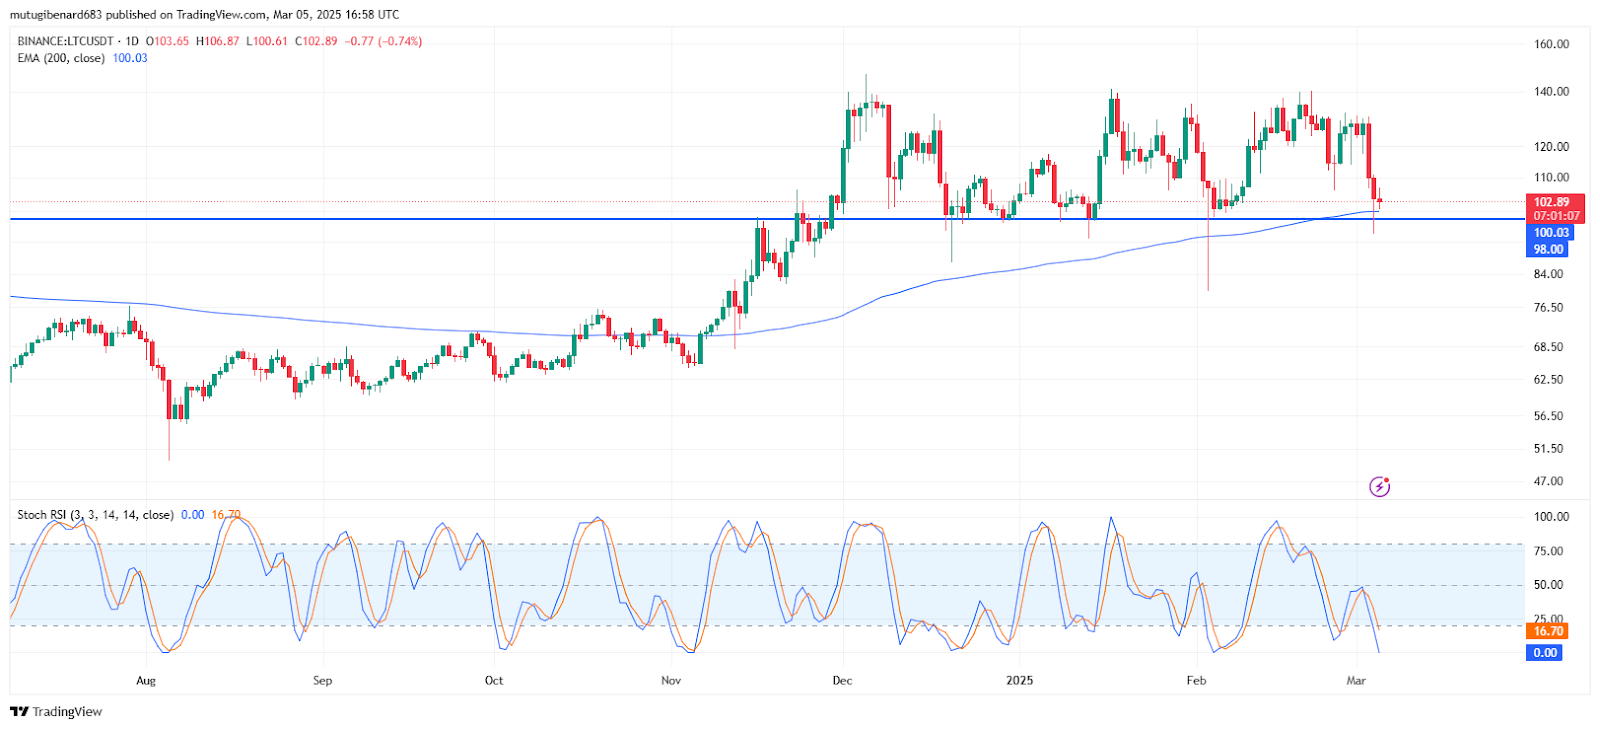
- Technical charts indicate Litecoin’s trading range between $80 and $140, where there are repeated tests of support and resistance that inform the risk management strategy.
Litecoin remains under observation as the investors wait to determine the crucial support and resistance levels. Recent technical analysis offers crucial ranges that can determine Litecoin’s near-term movement.
Technical Levels and Price Action
Crypto veteran Ali_charts stated, “If Litecoin ($LTC) holds above $98, buying pressure could fuel a rally toward $135!” His tweet underscores the importance of the $98 level for market stability.
The chart displays significant swings between approximately $80 and $140. Horizontal lines mark levels at $100, $105, and $130 as support and resistance. Chart analysis reveals Litecoin’s historical volatility. Price levels have been tested repeatedly, and traders value these zones for decision-making. Historical trends indicate that price reversals occur when support zones hold firm.
Market Indicators and Technical Analysis
Technical indicators add clarity to LTC’s price movement. The chart incorporates a 200-day Exponential Moving Average near $98 to $100. This moving average serves as a key support level that traders monitor closely. Market momentum is assessed using the Stochastic RSI, which remains in oversold territory. Observers expect a bullish cross if the blue %K line rises above the orange %D line.
Technical indicators provide traders with entry and exit cues. Moving averages and oscillators are commonly used in digital asset analysis. They assist in confirming trend reversals and short-term price movements. Traders use these indicators to validate their positions and manage risk effectively. These indicators serve as a barometer for market rhythm.
Outlook and Trading Scenarios
Market participants consider both bullish and bearish scenarios based on key levels. A breakout above $130 may drive LTC toward the $130-$140 zone. Alternatively, a drop below the $100 support level could expose LTC to lower prices near $80-$90. Traders watch for a close below the 200-day moving average as a bearish signal.
Crypto analyst Moon Whales also emphasized that LTC is testing its ascending trendline support. They mentioned that a strong bounce might send LTC toward the $130-$140 resistance zone. Market observers expect increased buying pressure if support holds above $98. Trading activity remains robust despite a weekly decline of 19.75%.
Market sentiment remains mixed among experienced participants. Both fundamental and technical analysis drive decisions, while liquidity and volume fluctuations continue to affect price dynamics. Analysts monitor LTC closely as trading volumes fluctuate. The asset’s performance may depend on global market trends.