
- Market data shows Litecoin’s MVRV ratio and price move in tandem, with the 200-day moving average serving as a long-term support benchmark.
- Technical analysis indicates the Stochastic RSI remains near oversold levels, while an upward crossover has aligned with price recoveries and market movement.
- On-chain data and indicators emphasize that maintaining support near $95 could help drive price movements, encouraging traders to engage in market participation.
Litecoin (LTC) continues to exhibit a bullish outlook, supported by its Market Value to Realized Value (MVRV) ratio. On-chain metrics indicate a potential rebound if key support levels hold.
MVRV Ratio and Price Trends
Crypto analyst Ali Martinez reported that Litecoin’s MVRV ratio stands at 15.91%. The metric is used by market participants to assess market phases. Higher ratios often occur during profit-taking events and corrections. The ratio assists investors in timing entry and exit points.
The chart indicates that Litecoin’s price and MVRV ratio follow similar trends. Increases in price coincide with ratio rises, while declines correspond with ratio drops. The 200-day moving average acts as a long-term support level. Historical data shows that when price remains above the 200-day moving average, recovery is common. Dips below this average have coincided with price weakness. Analysts use the 200-day moving average as a benchmark for long-term performance.
Market Sentiment and Potential Scenarios
On-chain data indicates that keeping the MVRV ratio above the 200-day moving average may correlate with sustained price trends. A break above recent highs could bring Litecoin near new resistance levels. Market participants compare current levels with historical trends for context.
Conversely, if the ratio declines toward the 4% zone, it may signal undervaluation. Traders monitor the $95 support level closely. Failure to hold this support could lead to declines toward $90 or $85. Support levels and ratio movements are tracked in real time by traders.
Stochastic RSI and Future Outlook
The Stochastic RSI indicator is near oversold territory, typically below the 20 level. Historical data shows upward crossovers have followed short-term price recoveries. Technical indicators offer additional reference points for market behavior.
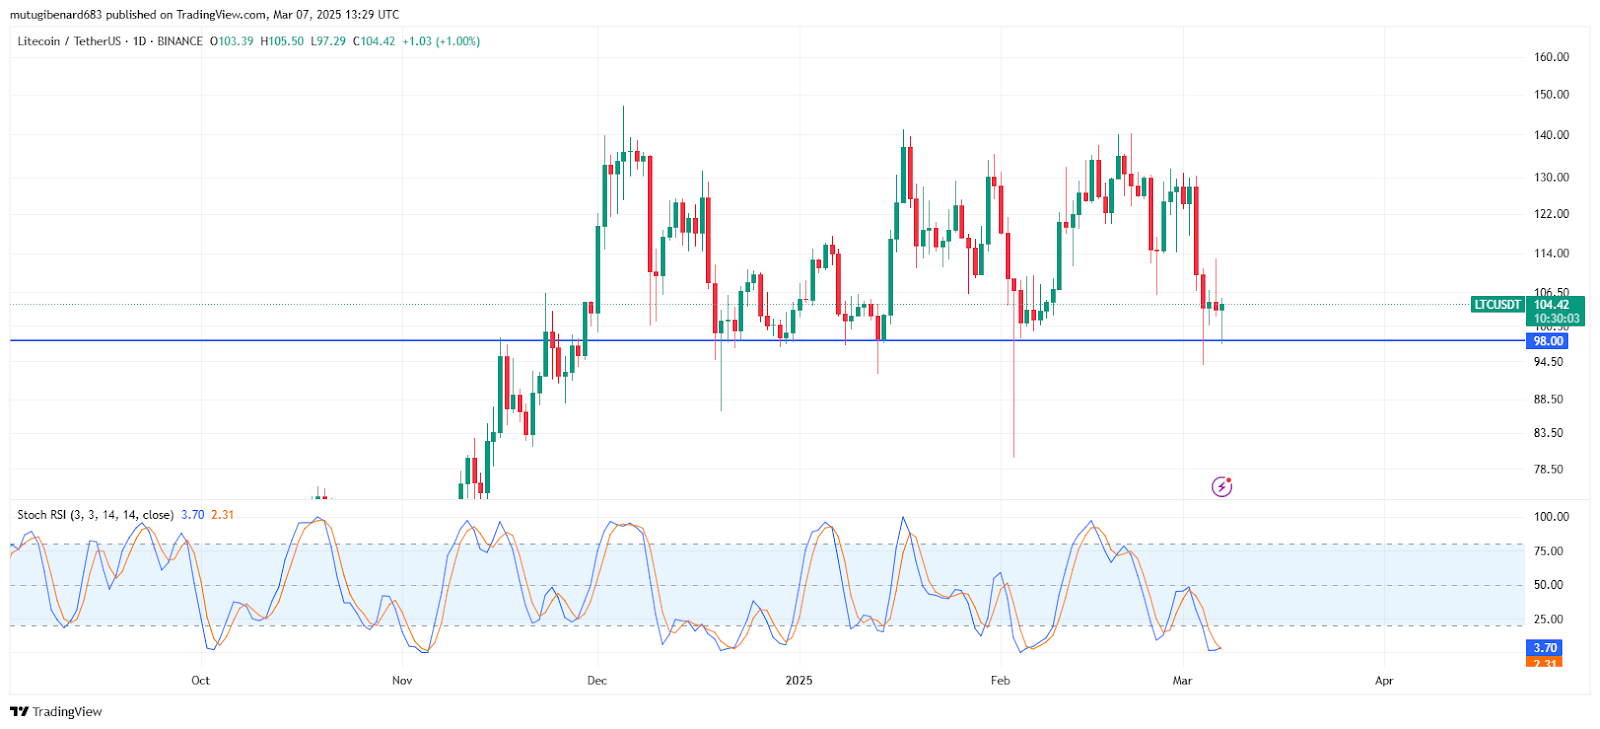
If Litecoin defends the $95 support and the Stochastic RSI shows an upward crossover, prices may reach $105 to $110. If support is not maintained, extended losses with targets around $90 have been observed. Observations from on-chain data support these scenarios without providing guarantees.
Litecoin was trading at $104.86 as of writing. The asset experienced a 1.67% decline in the last 24 hours and a 12.09% drop over the past week.