
- The MVRV at -16.3% suggests a market bottom, historically leading to Chainlink (LINK) rallies by up to 312%.
- LINK holds strong support between $17.50 and $18.50, with resistance at $20-$21; a breakout could lead to $25-$27.
- Technical indicators are suggesting bearish momentum to ease, and the market expects confirmation by the RSI above 50 and the MACD crossover.
Chainlink (LINK) also seems to be recovering from the potential downturn, and the MVRV ratio dips to -16.3% historically, reflecting the rebounds in the cryptocurrency. LINK already increased by 312%, 64%, 61%, 25%, and 52% in the previous past after hitting the same MVRV. The breakout is closely eyed by the traders, and LINK is recovering from the corrections.
MVRV Ratio Signals Market Bottom
Crypto analyst Ali_charts shared on X that the previous rebounds duplicated the same dips in the MVRV. History could repeat, and LINK could be ready to continue the upward trend. The cryptocurrency’s current price already rests above significant support levels, making the case for the potential rebound all the more enticing.
The MVRV (Market Value to Realized Value) rate computes the profit or the loss to the investor who invested in LINK during the last 30 days. The high rate in the MVRV implies most are in profit, and there’s heavy pressure to offload. The low rate in the MVRV implies the investor in the red, often suggesting the bottom in the market. The current rate in the MVRV at -16.3% could place LINK in the accumulation period, in sync with the previous recoveries.
Key Market Levels and Technical Levels
LINK is in a good support area between $17.50 and $18.50, and buyers are stopping the falls. It could see a run to $25–$27 if it holds at this point and crosses above $20. The resistance in the near future lies at $20.00–$21.00, and the main resistance lies at $25.00–$27.50.
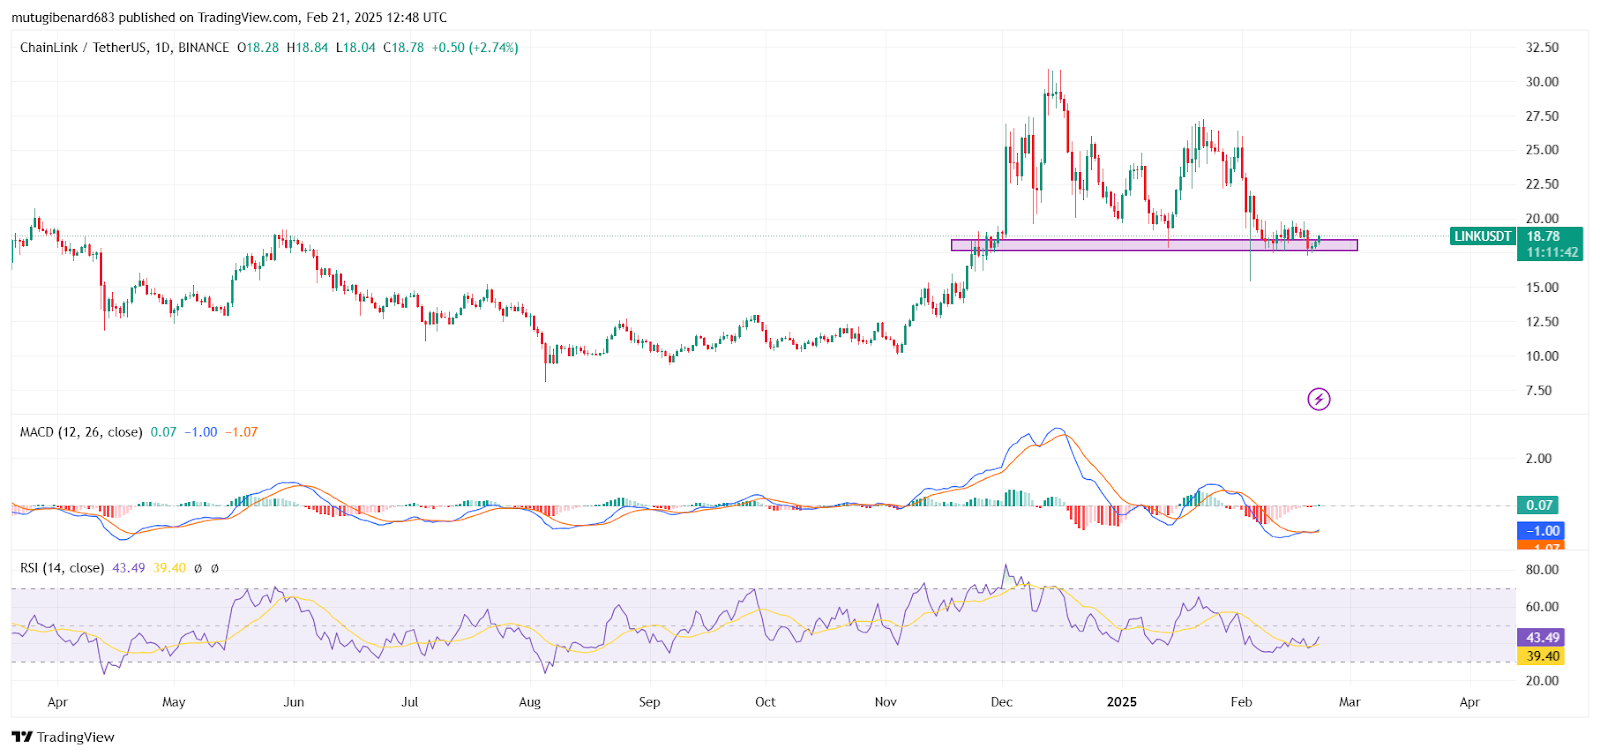
Technical indicators are conflicting. The MACD (-1.01) remains beneath the signal (-1.08) and so continues to suggest bear pressure. A flattening histogram, however, suggests waning bear pressure. A bullish MACD crossover would confirm the trend turn upwards.
The Relative Strength Index (RSI) at 43.05 is recovering from overselling. RSI greater than 50 would be indicative of developing bullish momentum.
Potential Scenarios for LINK’s Price Action
If LINK maintains above $18.50 and the technical indicators become favorable, the price could surge to $20 and above. A breakout above the resistance at $21 would affirm bullish pressure, possibly to $25–$27.
On the flip side, a breakdown to less than $17.50 would break the support area, and LINK would experience further declines to the zone around $15–$16. A breakdown through $15 could see a steep pullback.
At the time of writing, LINK was priced at $18.67, reflecting a 2.49% increase in the last 24 hours and a 1.75% decline over the past week.