- TRON recorded $23.85 million in monthly revenue, nearly four times Ethereum’s $6.04 million, according to figures shared by Whale Factor.
- The annualized revenue multiples range widely: MON is 58x; TRX is 108x; ETH is nearly 3,900x; and BNB is over 5,300x.
- Base-layer figures exclude some application earnings, meaning reported chain revenue cannot capture every network’s wider economic activity.
Layer 1 revenue data pushes TRON ahead of nine other competing networks, as big valuation disparities will cause some investors to question the valuation of blockchain activity.
TRON Leads the Monthly Revenue Rankings
Whale Factor’s market comparison puts TRON ($TRX) at the top, with 23.85millioninmonthlyrevenue.Ethereum(ETH) follows at 6.04million,whileSolana(SOL) records $3.32 million. BNB comes next at $1.49 million, leaving a wide gap behind the leading networks.
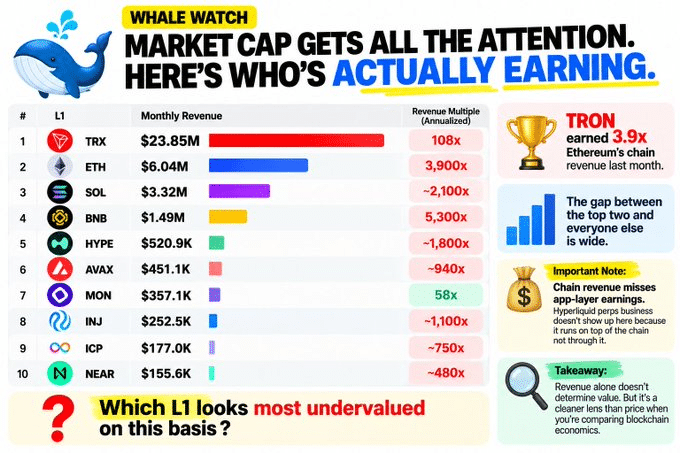
TRON generated nearly 3.9 times Ethereum’s reported chain revenue during the measured month. Its lead over Ethereum amounts to $17.81 million, based on the figures provided. However, the comparison measures reported revenue, not the full value of each ecosystem.
The remaining networks report smaller monthly totals in Whale Factor’s figures. Hyperliquid ($HYPE) records 520,900,followedbyAvalanche(AVAX) at 451,100.Monad(MON), Injective (INJ),InternetComputer(ICP) and NEAR complete the list.
TRX traded near $0.3301 on October 26, 2026, according to MetaMask’s market data. That price provides market context, but it does not explain the network’s revenue lead. Revenue and token price measure different aspects of a blockchain’s market position.
Valuation Multiples Show a Wide Divide
Whale Factor also compares token valuations against annualized chain revenue. TRX carries a multiple of 108 times, while MON stands at 58 times. Ethereum’s multiple approaches are 3,900 times, while BNB is over 5,300 times.
These are stark contrasts between reported revenue and market value. When investors believe that activity will increase in the future, they can indicate higher multiples. However, a lower multiple alone does not prove an undervalued asset.
MON’s lower multiple may draw attention from investors comparing network valuations. However, a lower valuation is not enough to show that an asset is undervalued. Revenue trends, token supply and future demand also affect that assessment.
Ethereum’s multiple presents a different picture from TRON’s reported revenue lead. Its valuation may reflect expectations beyond the revenue captured in this comparison. The figures alone cannot confirm whether those expectations will be met.
Application Earnings Leave Part of the Picture Out
The post cautions that base-layer revenue excludes earnings generated by some applications. Hyperliquid’s perpetual futures business runs on top of its underlying chain. Consequently, the reported $520,900 does not capture all revenue produced by that application.
This distinction matters when comparing networks with different economic structures. Some activity generates fees at the base layer, while applications collect revenue separately. A chain-only comparison can therefore miss earnings created elsewhere in its ecosystem.
The same figures also provide only a monthly snapshot of network activity. Revenue can change as transaction demand, fees and market conditions shift. Multiplying one month’s total by twelve may distort valuations if activity changes.
The ranking does not show whether revenue remains steady across several months. Nor does network revenue automatically translate into income for token holders. Those questions require separate evidence beyond the supplied comparison.
TRON leads the listed networks on monthly revenue, while MON has the lowest stated multiple. Neither figure settles which token offers better value. Investors would need consistent revenue records, token valuation data and evidence of future demand before drawing that conclusion.