

- Kusama (KSM) has broken out of a 705-day resistance, signaling a potential bullish reversal and setting the stage for strong price action.
- Technical indicators like RSI and MACD show growing momentum, supporting a possible breakout toward the $24-$26 resistance range.
- With a bullish scenario in play, KSM could see a significant rally, targeting $482.7—over 2,262% above current levels.
The Kusama (KSM) network demonstrates strength as it recovers from testing a vital support range while technical patterns indicate a potential upward price change. Analysts observe a potential trend reversal because the price showed signs of a breakout from its descending channel structure.
JAVONMARKS tweeted that Kusama’s price has held strong despite previous resistance, and a breakout could set the stage for a major rally. The target remains at $482.7, representing a potential 2,262% surge from current levels. This prediction highlights the magnitude of the breakout, which could provide a significant upside if current trends hold.
The tweet also emphasizes that Kusama has been holding above a key resistance level after approximately 705 days of downward pressure. If the breakout sustains, it could lead to a transformative bullish reversal, creating new momentum for the asset in the long term.
Price Action & Key Levels
KSM has been in a downtrend, forming a descending channel (marked by two blue lines). The price recently tested a major support zone (~$18-$20), shown in purple. After bouncing off this support zone, the price is attempting a breakout from the descending channel.
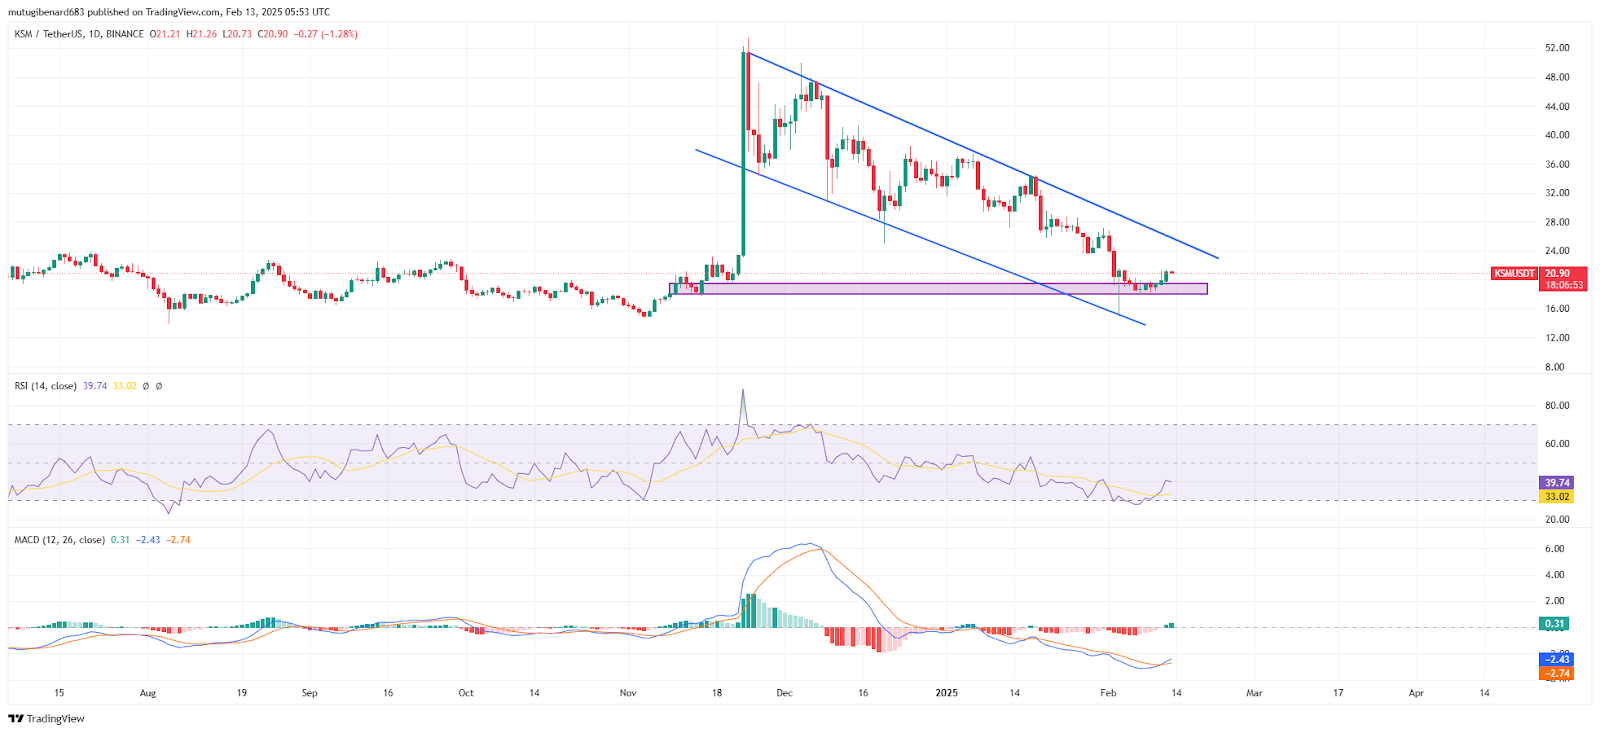
Support Level: $18-$20 This area has been tested multiple times and is holding strong. A breakdown below this zone could trigger further downside toward $15 or lower. Resistance Level: Upper boundary of the descending channel (~$24-$26) A confirmed breakout above this level could lead to a bullish reversal.
Current RSI: 39.59 The RSI is recovering from oversold levels but is still below 50, indicating weak momentum. If RSI breaks above 50, it would confirm a bullish shift.
The MACD line is crossing above the signal line. The histogram is turning positive, suggesting a potential bullish reversal. If MACD sustains its upward trend, momentum will favor buyers.
Possible Scenarios
Bullish Case (Breakout Above Channel) If the price breaks above $24-$26 and the channel, bullish confirmation will be in place. The next resistance levels would be $30 and $36. Bearish Case (Rejection & Breakdown) If the price fails to break out and drops below $18, it could retest $15 or lower. A new downtrend could form if the support breaks.
KSM is at a crucial level, trying to break out of its descending channel after bouncing from strong support. RSI and MACD suggest potential bullish momentum. A break above $24-$26 would confirm an uptrend, while a drop below $18 could extend the downtrend.
At the time of writing, the price of Kusama (KSM) maintained at $20.81 while its 24-hour trading volume reached $18,215,926. The value of Kusama (KSM) indicates a 5.51% upward shift in the last 24 hours and has grown by 6.48% throughout the previous week.