
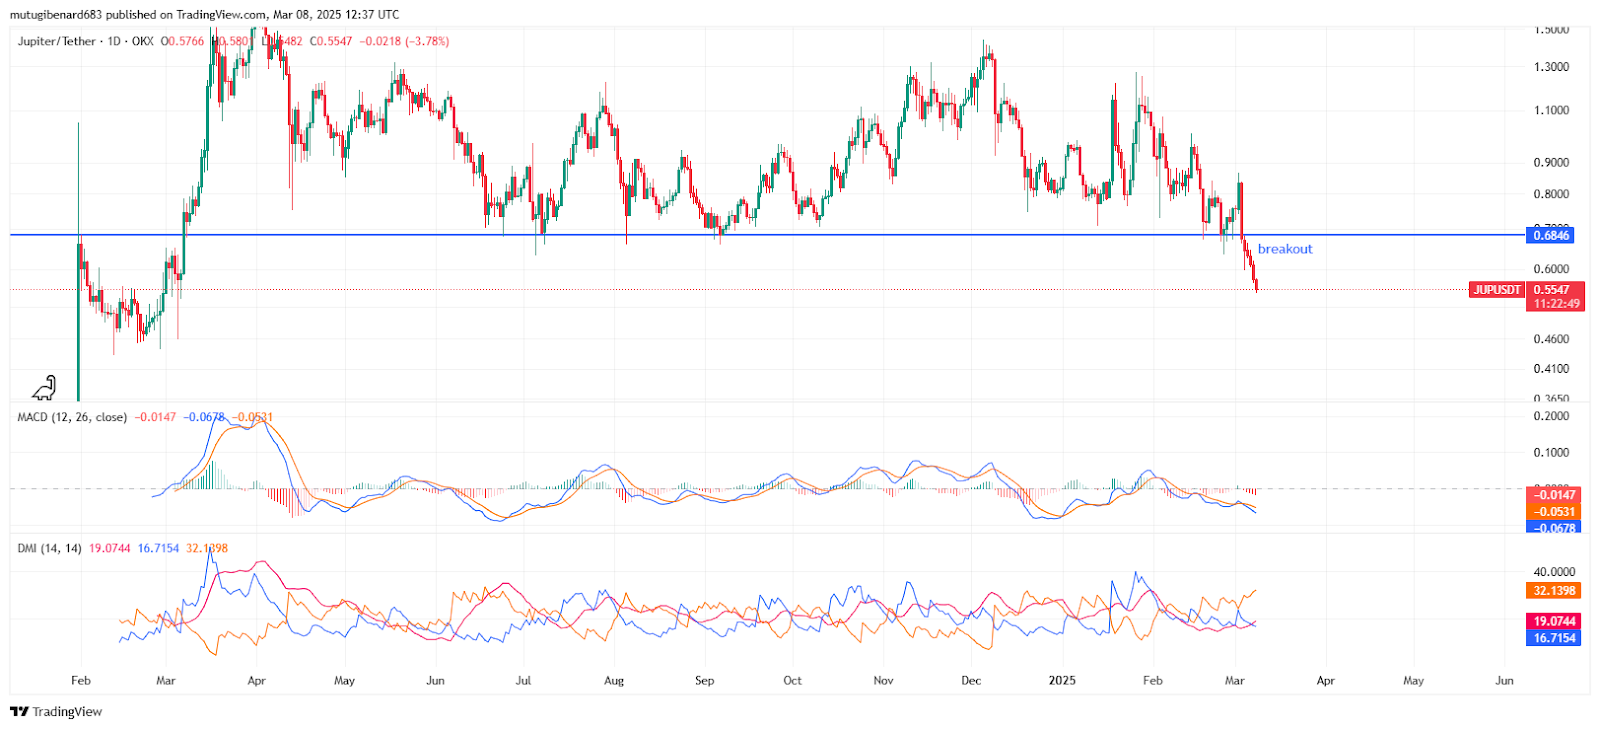
- Jupiter (JUP) price action shifts as it falls below the critical $0.65 support level, confirming bearish momentum with a clear technical breakdown.
- Technical indicators, including MACD, DMI, and ADX, reveal a strong downtrend, as the moving average crosses and histogram patterns emphasize selling pressure.
- Analysts note that reclaiming support levels between $0.75 and $0.85 may reverse the bearish trend as traders eye resistance zones for entries.
Jupiter (JUP) is bearish in momentum as it crosses key support. The price has moved from a consolidation to a downtrend, and investors are advised to be cautious. Market conditions suggest that more price decline is in the offing.
Technical Analysis and Price Levels
Recent analysis shows the price trades below $0.65, a key support level. This breakdown confirms a market shift from consolidation to a downtrend. A tweet from Ali_charts reported that $JUP broke out of a parallel channel. The tweet set a potential move toward $0.35 as price momentum increased.
The price breakdown indicates a clear market structure change. Traders view the drop below key levels as a sign of further decline. Observers note that technical resistance now plays a vital role. Market participants follow price movements closely.
Trading Indicators and Market Sentiment
The MACD line crossed below the signal line. The red histogram bars show growing selling pressure. The DMI analysis confirms the downtrend with the +DI below the -DI. An ADX of 32.13 indicates a robust trend. These Indicators suggest a possibility of continued bearish pressure.
Indicators serve as key tools for technical assessment. Analysts track MACD and directional movement to monitor market trends. The current setup reflects a strong bearish stance. Indicators may prompt cautious trading decisions among market participants.
Future Prospects and Support Levels
Technical analysis suggests that further declines may test support near $0.53. Price recovery requires reclaiming levels between $0.75 and $0.85. Short traders may enter positions near resistance zones. The breakdown below $0.65 signals continued bearish momentum. The market may find support at $0.50, and further decline may lead towards $0.35.
At the time of writing, trading data places Jupiter (JUP) at $0.5525. The asset lost 9% in 24 hours. A seven-day decline reached nearly 25%. Trading volume hit $112,718,339, indicating active market participation.