
- Google’s sharp 16% drop in February makes it the cheapest Magnificent Seven stock, but technicals show potential further downside.
- The stock’s uptrend faces pressure after breaking below key moving averages, with $170 and $160 acting as crucial support levels.
- A 20% decline from all-time highs in just 16 days signals bearish momentum, with resistance at $177.33 needing a reclaim for recovery.
Google (GOOG) experienced a sharp 16% decline in February, which is the worst monthly performance in nearly three years. At 22x earnings, it is now the cheapest among the Magnificent Seven stocks. The recent selloff has raised questions about whether this presents a buying opportunity or signals further downside risk.
Bullish Structure Faces Pressure
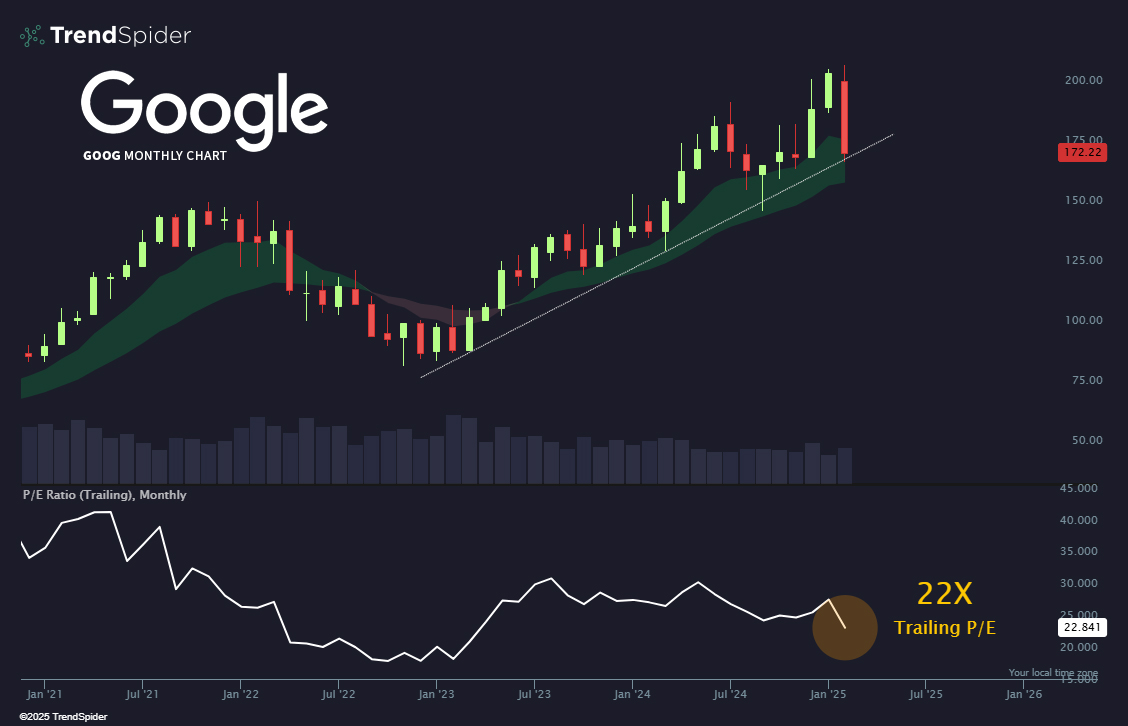
TrendSpider’s monthly chart indicates that Google had been in a strong uptrend since early 2023. Prices formed higher highs and higher lows, staying above the moving average envelope. This green zone acted as dynamic support, reinforcing the bullish structure.
A strong rally in mid-2023 pushed Google’s price to a peak near $200. However, a sharp red candlestick recently emerged, signaling a potential pullback. Currently, the stock is trading at $172.22, slightly below its recent highs.
A trendline aligns with the higher lows, indicating continued uptrend support. Despite the recent downturn, Google remains above this trendline, keeping the bullish structure intact. Additionally, volume activity shows spikes during key price movements, reflecting strong participation from traders.
Moreover, the trailing P/E ratio has been a key factor. After declining between mid-2021 and mid-2022, it rebounded in 2023. Presently, Google’s P/E ratio stands at 22.84, aligning with the stock’s broader uptrend. Despite the correction, this valuation remains reasonable compared to historical levels.
Breakout to Breakdown: A 20% Decline
Jack from AlphaCharts365 highlights a different perspective using Google’s daily chart. The stock transitioned from all-time highs to a 20% decline in just 16 trading days. This sudden drop pushed it below the 200-day moving average, confirming bearish momentum.
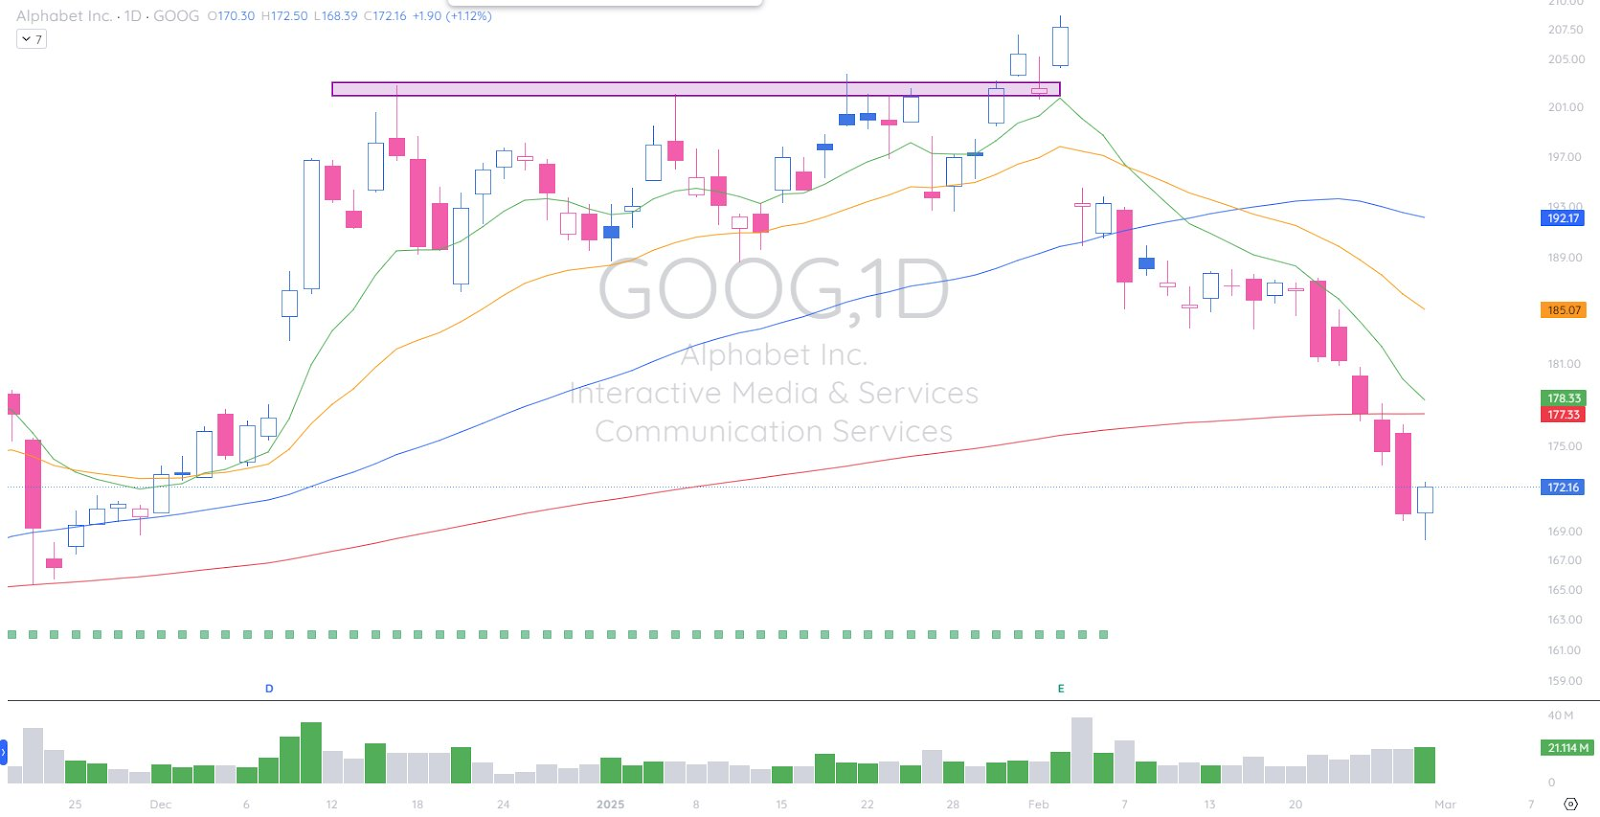
The stock formed an uptrend from late November 2024 to mid-January, peaking at $200. However, multiple rejections at this level signaled resistance. By early February, Google entered a downtrend, forming lower highs and lower lows.
Moving averages played a crucial role in this shift. Initially, the stock stayed above its short-, mid-, and long-term moving averages. However, as selling pressure intensified, prices fell below the key support levels. Notably, the long-term moving average failed to hold, accelerating the downturn.
Volume trends reflect this bearish shift. Green bars in December showed strong buying interest, but February saw increased red bars. A significant volume spike accompanied the recent drop, indicating panic selling.
Google now finds support near $170 and $160, levels where previous price reactions occurred. A key resistance lies at $177.33, which previously served as support. If the stock fails to reclaim this level, further downside could follow.