
- FIL/USDT has broken above a descending resistance line and is consolidating just above the breakout level on the daily timeframe.
- Volume increased slightly during the breakout, signaling rising trader interest and the potential for a bullish continuation if support holds.
- Weekly chart shows a bounce from a long-term support level, with higher targets projected upon breaking the 50-week moving average.
FIL/USDT is showing early bullish signals as it trades just above a key descending resistance line on the daily chart. This development suggests the possibility of a trend shift after a prolonged downtrend.
Daily Chart Shows Bullish Retest Formation
A tweet from Butterfly_chart outlines that FIL/USDT has successfully broken above a descending resistance line, a pattern that had capped price advances for months. This resistance had kept FIL in a steady decline, with each attempt at recovery met by selling pressure.
Currently, the asset is consolidating just above the former resistance. This structure indicates a possible bullish retest, where the resistance turns into support. This setup is often viewed as a preparatory phase for further upward momentum if the structure holds.
Volume in the breakout stage has posted a slight rise. Not spectacular, but it indicates increasing interest from players. If such consolidation base continues to be intact, it may trigger the rally in the $4.20 to $4.80 region, depending on overall market action.
Weekly Timeframe Holds Long-Term Support
According to another analyst Jonathan Carter, the weekly chart paints a broader picture. FIL has recently rebounded from the lower boundary of a descending triangle. This level has remained a consistent support zone since 2021, signaling a strong base of accumulation.
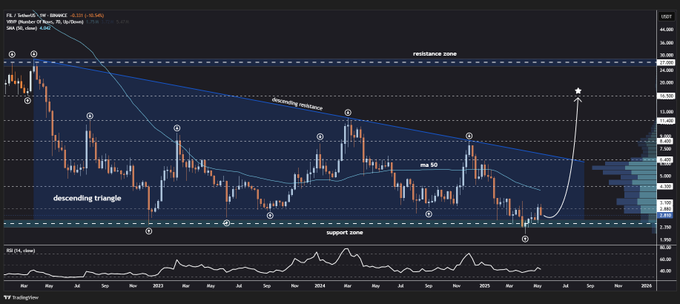
Despite the downward pattern, the price has maintained this level, suggesting that buyers are active in this zone. However, Carter notes that for a stronger bullish case, FIL must break above the 50-week moving average. A successful breakout above this technical barrier could unlock higher targets at $6.40, $8.40, $11.40, and even $16.50 in the longer term.
Trend Reversal Gathers Attention
The alignment of bullish indicators on both the daily and weekly charts is attracting attention. The breakout on the daily chart is viewed as a short-term shift, while the weekly support bounce could hint at a longer-term reversal.
As FIL/USDT holds above former resistance and continues to trade above its long-term support, market participants will likely monitor its next moves closely. Confirmation above the moving average could trigger broader momentum toward higher targets.