
- FET broke above its descending channel near $0.61, aligning EMA and SMA for the first bullish crossover in weeks.
- Upside targets for FET include $0.66, $0.70, and $0.74, reflecting prior supply zones and growing bullish sentiment.
- Binance data shows retail and top traders heavily long, supporting momentum while increasing probability of continued upward price action.
Fetch.ai (FET) is showing signs of recovery after breaking out of a declining channel near the $0.61 area, and it is likely that a trend reversal is in effect. In the last 24 hours, the price of FET increased by 3.16% trading at $0.6196.
Breakout Above Resistance Levels
Alpha Crypto Signal reported that FET has moved above the mid-channel resistance and the exponential moving average near $0.61. This marks the first major attempt to regain bullish structure since mid-August. The breakout is attracting attention as it comes after weeks of lower highs and lower lows within the channel.
The 4H chart indicates that the price is testing the $0.62 level, where the channel’s upper boundary lies.With the 9 EMA at $0.609, and the 50 SMA at $0.611 both under the market price, there is a crossover, which may be of interest to traders.
If this breakout holds, the upside potential targets could be; $0.66, $0.70, and $0.74, as there were previous supply zones at these levels. In a case or a scenario that momentum does not hold, there could be a further drop, back towards $0.59, or to the lower level of support near $0.57.
Technical Structure Turning Constructive
Since mid-August, FET price action has been guided by a descending parallel channel, consistently creating lower highs and lows. This structure has shown sustained selling pressure, keeping buyers on the defensive. The breakout now indicates a possible shift in momentum toward the upside.
The alignment of moving averages is particularly notable. Both the EMA and SMA support the possibility of trend change, but traders are watching for confirmation through higher volume and follow-through candles. Sustained price action above the channel would strengthen the case for continued recovery.
Support zones remain important if the breakout fails. Levels around $0.58, $0.55, and $0.52 could serve as potential retests before buyers attempt another rally.
Long and Short Positions Show Bullish Bias
Market sentiment in the derivatives sector supports the breakout narrative. Data from Binance shows retail traders holding a long-to-short ratio of 1.78. This reflects expectations that the upward move may continue in the short term.
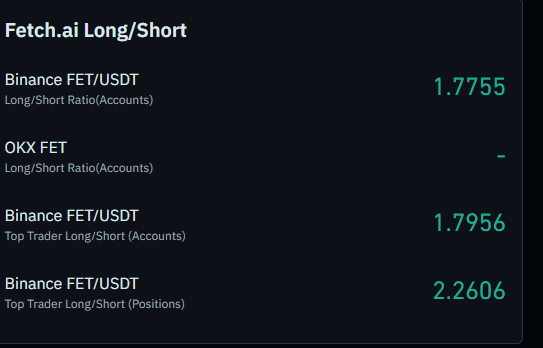
More notably, top traders are positioned even more aggressively, with accounts showing a ratio of 1.79 and positions reaching 2.26. This alignment between retail and professional traders suggests confidence in the recovery attempt.
However, heavy long positioning also introduces the risk of a corrective pullback. Sudden liquidity hunts may occur before FET resumes upward momentum. Despite that, the current structure suggests that bulls are attempting to regain control of the market.