- Ethereum whales added over 5 million ETH since early 2024, marking the strongest accumulation phase since the 2018 peak.
- April 2025 showed the highest monthly whale accumulation as ETH reclaimed $3,000, signaling renewed smart money interest.
- Bitcoin eyes $110K as futures heatmaps reveal massive short liquidations and liquidity concentration above current price levels.
Ethereum whale wallets are witnessing their strongest accumulation since 2018, according to recent analysis by Merlijn The Trader. While most retail traders remain distracted, smart money entities are making aggressive moves.
From April 2017 to April 2025, Ethereum whale addresses holding 1,000 to 10,000 ETH showed notable accumulation patterns. Price soared above $1,300 by early 2018 as whale holdings peaked at over 18 million ETH. However, as prices plunged to sub-$100 levels in late 2018, whale addresses offloaded positions. Accumulation returned between 2020 and late 2021 when ETH touched $4,800. Yet, from 2022 to mid-2023, supply held by whales dropped to 13 million ETH amid a bearish cycle.

Source: Merlijn The Trader
Whales Reclaim Lost Ground in 2024
By early 2024, Ethereum’s price recovery triggered renewed interest from whale investors. Their holdings jumped sharply from 13 million to 18 million ETH. Moreover, April 2025 recorded the largest single-month accumulation throughout the observed timeline. This surge aligned with ETH’s rally past $3,000. Besides that, the net position change bars turned heavily positive, underscoring a strong buy-side push. Consequently, whales now hold ETH at levels last seen during early 2018.
Additionally, this simultaneous growth in price and holdings indicates a coordinated effort by large entities. Hence, the ETH market may soon reflect this capital shift more visibly.
Bitcoin Tests High Liquidity Levels
Merlijn also shared insights into BTC futures market dynamics. The Binance BTC/USDT perpetual heatmap exposed concentrated liquidity between $110,000 and $112,000. Short positions dominate this region, suggesting that breakouts could trigger mass liquidations. BTC recently dipped to around $100,000 before rebounding near $107,000.
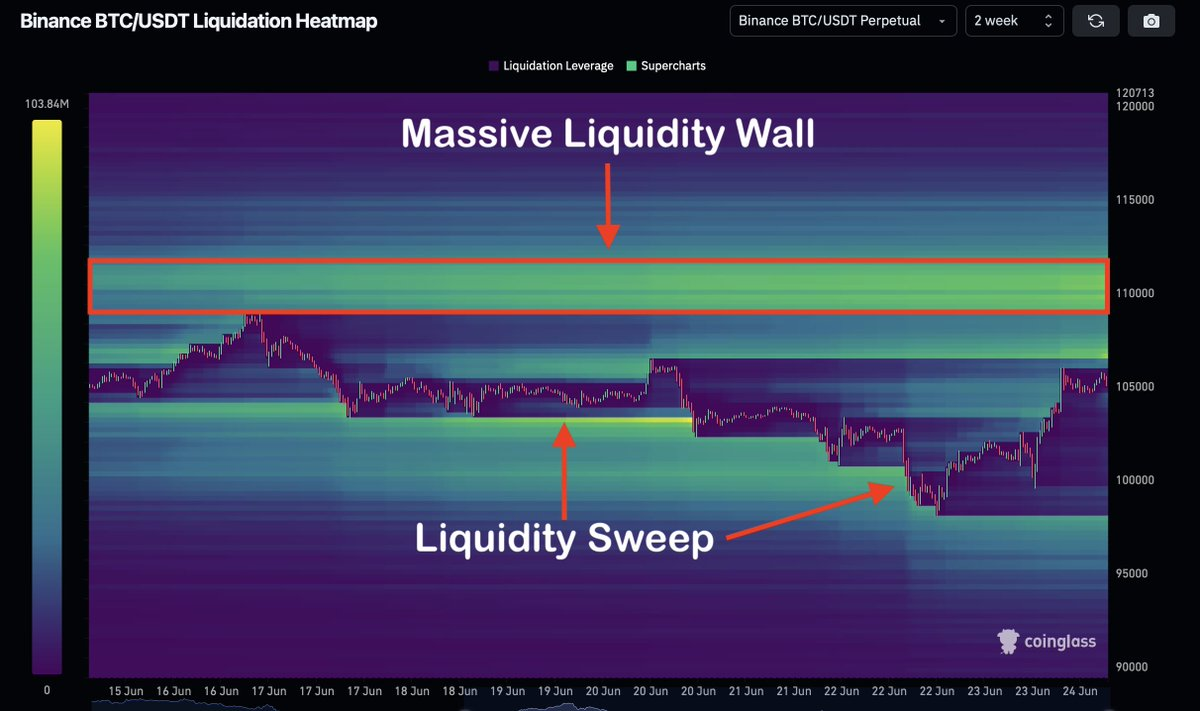
Source: Merlijn The Trader
Moreover, liquidation sweeps were evident between $102,000 and $104,000. Several long positions got wiped out during this volatile zone. However, buyers reclaimed momentum fast. The heatmap shows brighter yellow zones above current prices. These zones represent higher leverage and heavier positions, particularly around $110,000.
More liquidity lies above Bitcoin’s current price than below. This imbalance sets up a strong upside breakout potential. Hence, if bulls breach the resistance wall, a rapid rally toward $110K becomes highly probable.