
- Ethereum whales accumulated 5.54M ETH since April, raising collective holdings to 45.2M, a 14% increase.
- Price opened at $4,452.76 on Sept 4 but closed at $4,366.44, a 1.96% daily decline.
- The MVRV Z-Score at 27.87 shows notable unrealized profits, below the peak of 56.36 linked to overheated markets.
Ethereum has returned to levels close to $4,500, with large holders steadily increasing their balances over the past five months. Wallets containing between 1,000 and 100,000 ETH have accumulated 5.54 million coins since April 3, 2025.

This growth is a 14% rise in holdings, strengthening their collective balance to 45.2 million ETH. The consistent buying trend from these so called whales shows their growing control of supply, with accumulation closely aligned to the asset’s rising price.
Whale Accumulation and Market Impact
These investors added coins during periods of steady price appreciation, supporting Ethereum’s upward momentum. Data shows that each accumulation phase coincided with higher lows and extended rallies, keeping the market on a clear uptrend.
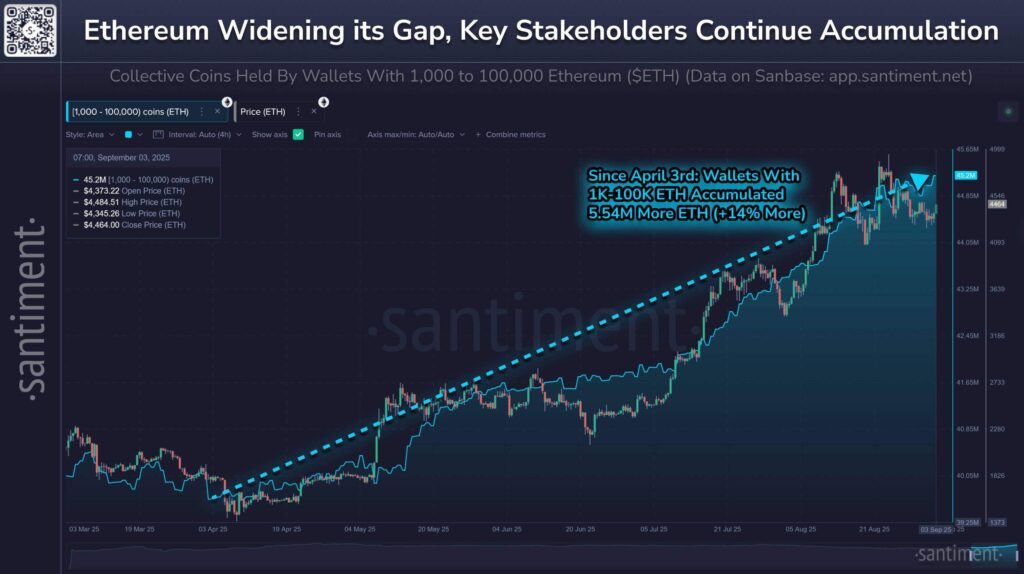
As of September 3, Ethereum opened at $4,373, peaked at $4,484, dipped to $4,345, and closed at $4,464. The dotted trendline tracking whale balances and price movements indicates a firm upward slope, despite some consolidation following August’s highs.
Short Term Price Movement and Supply Outlook
However, Ethereum saw a pullback the following day. On September 4, the asset opened at $4,452, reached $4,484, fell to $4,365, and closed at $4,366. This was a 1.96% daily decline, though prices remain above the mid year breakout levels.
Earlier in 2025, Ethereum traded below $2,000 before breaking out in April and May, forming an ascending channel that steadily lifted it toward $4,500. The movement aligns with reduced circulating supply, as accumulation removes coins from exchange balances.
On Chain Metrics and Investor Caution
On chain data further supports this accumulation trend. The Accumulation/Distribution line is at 48.15 million, showing consistent inflows despite recent consolidation. Volume data also shows strong activity during breakout months between April and July, though recent sessions show lighter activity.
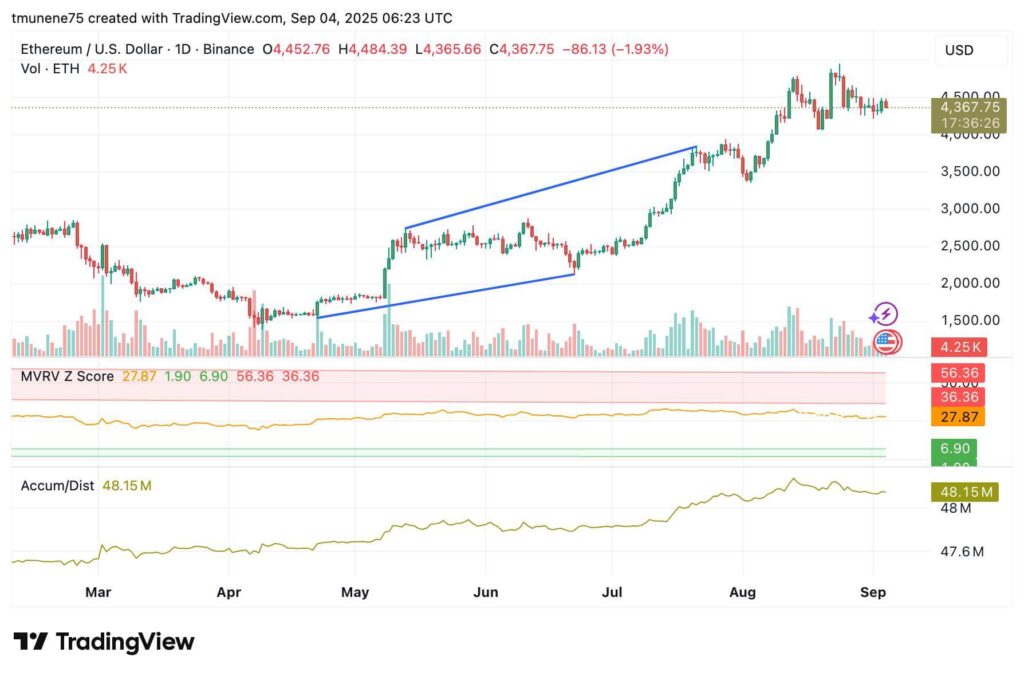
Meanwhile, the MVRV Z-Score is at 27.87. Historically, higher levels, such as 56.36, have aligned with overheated market conditions. While the present reading indicates substantial unrealized profits, it is below past extremes, showing the market is elevated but not at prior peaks.