
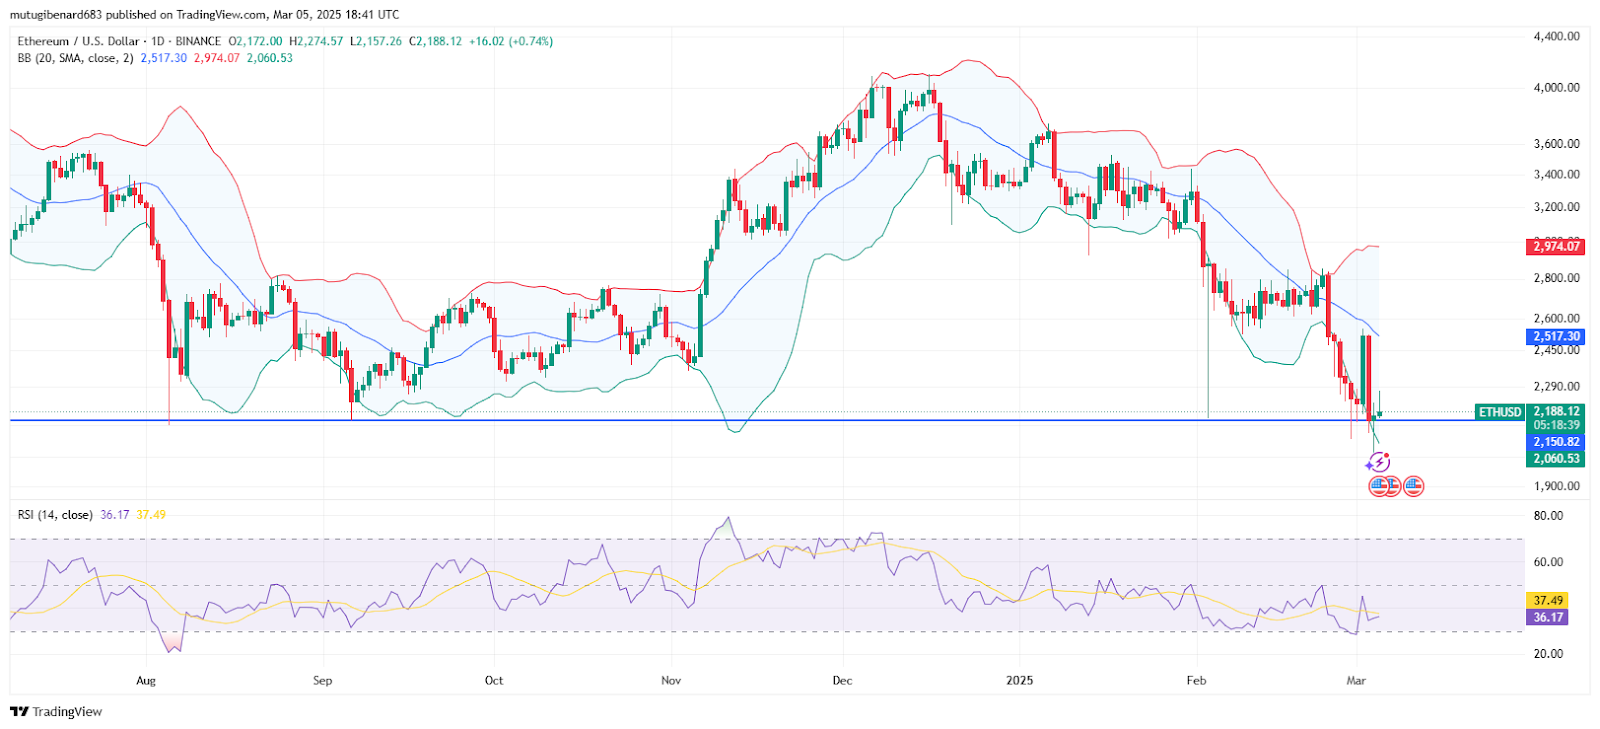
- Ethereum’s daily chart records a decline from over $3,400 to a critical support level near $2,150, prompting buyers to enter the market.
- Technical indicators, including Bollinger Bands and RSI, track volatility and momentum as ETH tests resistance near $2,500 with upper limits around $3,000.
- Recent trading volume near $25.4 billion and a 3.15% 24-hour increase underscore the market’s active behavior and measured recovery in ETH pricing.
Ethereum’s daily chart, covering mid-2024 to early March 2025, records a drop from peaks above $3,400 to a recent low near $2,150. The chart shows key support levels that guide recent price action.
Analysts Insight and Key Levels
A recent tweet by crypto veteran Ali Martinez stated that Ethereum is testing the lower boundary of a parallel channel. The tweet noted that reclaiming $2,350 could move ETH toward a range between $3,000 and $4,000.
The tweet provides a clear reference to numerical targets. It confirms that technical levels are observed in the recent price action. This information has been noted by several market observers.
Technical Indicators and Price Levels
At the time of writing, ETH was trading at approximately $2,195. A horizontal support line near $2,100 to $2,150 has served as a price floor. Data from the chart is used to mark key levels for traders.
An intermediate resistance is set near $2,500. Historical resistance appears between $3,000 and $3,400. Bollinger Bands indicate recent volatility as prices reached the lower band. RSI readings near 35–36 provide a current measure of market momentum. The chart integrates these indicators to form a factual record of price movements.
Technical measures such as support and resistance are clearly defined by the chart. The numerical data offers a structured view of ETH’s recent performance. Trading sessions have shown consistent behavior near these levels.
Trading Volume and Market Data
Ethereum experienced a decline from above $3,400 to near $2,100. The chart records a recovery from this recent low, with buyers entering at key levels. Price movement remains in line with the technical framework.
Trading volume reached about $25.4 billion recently. ETH price increased by 3.15% over the past 24 hours. A seven-day period shows a 7.12% decline. Market data from these sessions provides a numerical basis for evaluating short-term price changes. Recent volume figures contribute to a clearer record of market activity.