

- Technical analysis shows Ethereum trading near $2,228.62 with key support at $2,200, while market activity signals a potential rebound toward higher levels.
- The price range has fluctuated between $2,075 and $2,377, confirming strong technical levels that effectively guide trader decisions during dynamic market sessions.
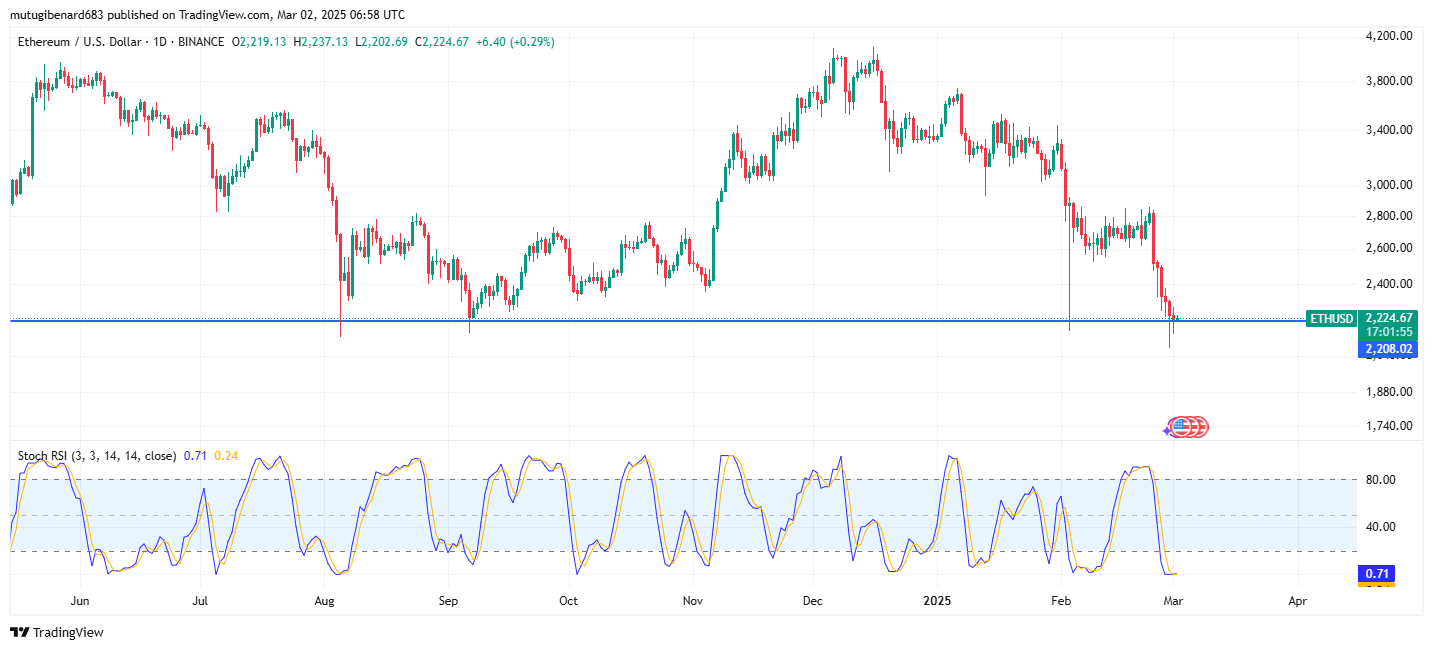
- Stochastic RSI readings at %K 0.96 and %D 0.32 underline oversold conditions, while market volume reinforces the importance of these technical indicators.
Ethereum navigates a challenging technical landscape as it trades near a critical support zone. Market data indicates a cautious outlook amid sharp price declines and defined resistance levels.
Technical Price Action and Market Trends
Recent charts show Ethereum experiencing swift price declines over recent sessions. Technical indicators record lower highs and lower lows. Analysts note that traders have become cautious amid volatile swings.
A tweet from crypto analyst Ali Martinez has drawn attention to the asset. He stated that if Ethereum holds above $2,200, it could set up a rebound toward $2,500 or even $3,000.
His observation has prompted many market participants to reassess their short-term strategies. The tweet reinforces the importance of key support levels in current trading.
Recent price candles reveal bearish momentum. Analysts have observed strong selling pressure in the recent sessions. The price movement shows that bearish trends remain dominant in the market. Market participants continue to monitor these rapid changes.
Support and Resistance Zones
Technical analysis identifies a strong horizontal support zone near $2,200. This level has been tested repeatedly during recent sessions. Buyers have often stepped in at this level, offering temporary relief. The asset’s recovery depends on holding this critical zone.
Resistance levels have been identified at both $3,000 and $4,000. The mid-range resistance near $3,000 has previously offered a base for minor bounces. The major resistance is at $4,000, which has proved challenging for price advances. These zones serve as crucial benchmarks for traders when setting targets.
Market Sentiment and Trading Scenarios
Market sentiment remains cautious amid prevailing bearish trends. The Stochastic RSI indicates that the asset is oversold, with % K at 0.96 and %D at 0.32.
These readings suggest that a short-term bounce is possible if buyers step in. Analysts monitor these indicators closely.
Many await a decisive move above the $2,200 mark. Ethereum’s current technical setup keeps market participants alert. The asset was trading at $2,228.62 at the time of writing, reflecting its recent price action and ongoing market sentiment.