

- The TD Sequential indicator has generated a buy signal on weekly and daily time frames, suggesting Ethereum may be nearing a local bottom.
- Ethereum’s support zone of $2,490–$2,500 is holding strong, and resistance at $2,730–$2,850 could be the key to the next breakout.
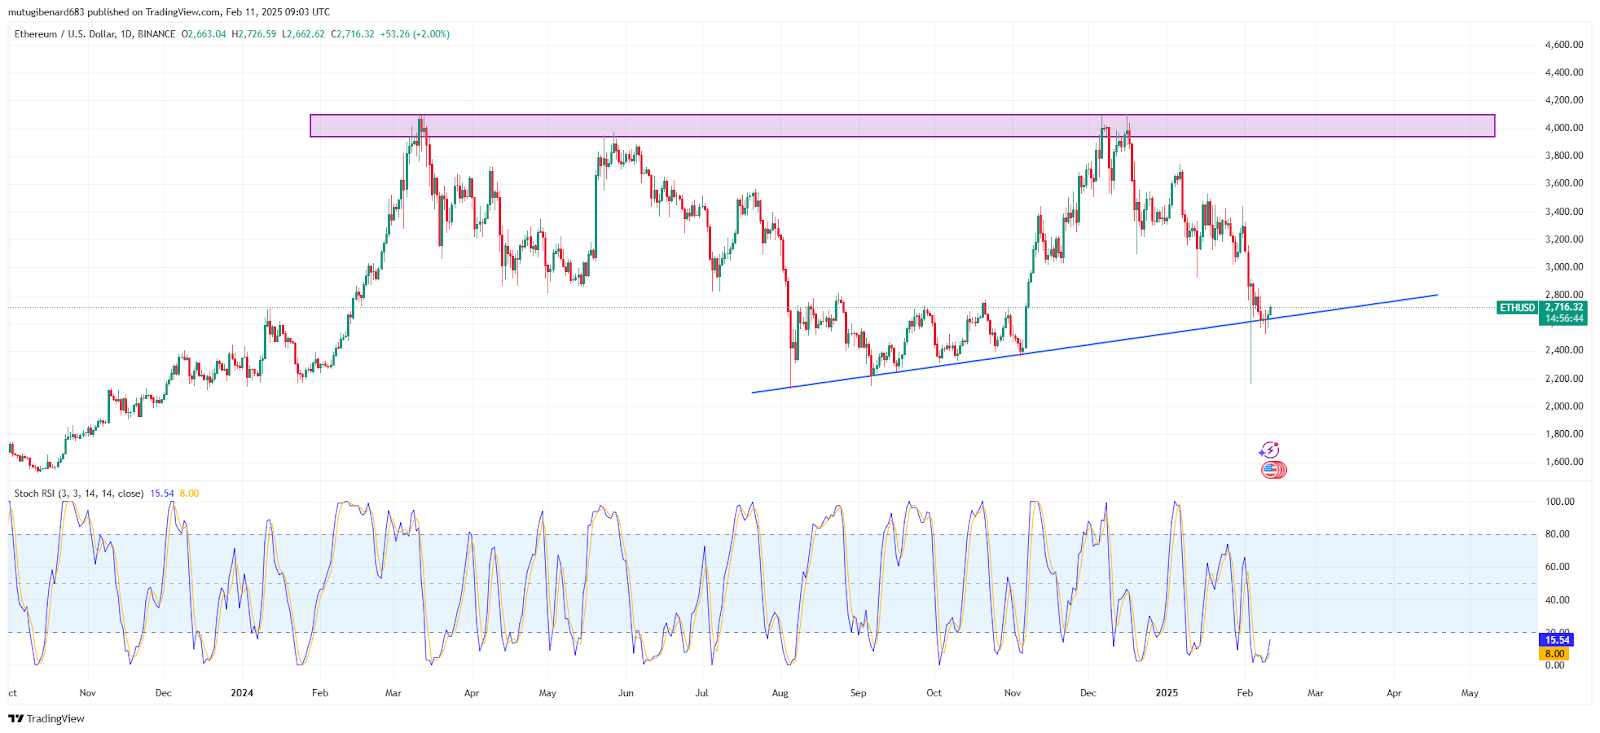
- The stochastic RSI indicates oversold conditions, with previous trends suggesting a potential price rebound to $3,200–$3,500 if momentum shifts.
Ethereum is indicating a possible bounce as technicals suggest a reversal in momentum. The TD Sequential indicator has presented a buy signal on the weekly and daily time frames, which may imply that selling pressure is weakening. Market patterns are suggesting a possible stabilization amidst a general bearish trend. Crypto analyst Ali mentioned this possible reversal on a tweet, where he mentioned that Ethereum “looks ready to rebound.”
Technical Indicators and Market Trends
During its downward phase, Ethereum produced successive lower highs and lower lows. A long lower wick on the most recent weekly candle shows that buyers made multiple investment attempts when prices dropped sharply. A potential support formation becomes apparent when this occurs.
The TD Sequential indicator plotted a red “9” on both the weekly and daily charts. Previously, the signal preceded a trend reversal or reduction in selling pressure. A black upward arrow on the chart also lends validity to the prospects of a bounce. Ethereum might go higher if crucial support levels are maintained. Ali’s tweet corroborated this forecast, noting that the TD Sequential signal means that Ethereum is nearing a local bottom.
Support and Resistance Levels
The first level of support for Ethereum exists between $2,490-$2,500. The protection of this zone by prior buyers makes it a vital area for observation. The potential resistance area exists between $2,730-$2,850. A price ascent above this selected area points toward additional growth of the upward trend. If Ethereum sustains support successfully, the lower targets become $2,300, then $2,200
Momentum Indicators and Price Movement
The Stochastic RSI indicator shows that Ethereum is oversold and ready for a momentum shift. Previous instances of similar readings have seen price bounces. Ethereum also recently touched an ascending trendline at around $2,500 and bounced higher, which shows that buyers are coming in at key levels.
At the time of writing, the Ethereum price was at $2,716.02, up 2.98% in the last 24 hours. Provided buying pressure is sustained, Ethereum may attempt to reclaim higher resistance levels, with $3,200 to $3,500 as the next target. However, if bearish momentum is sustained, a test of lower support zones remains on the cards.
Ethereum price action remains at a critical point.