
- Ethereum remains in a downtrend channel, with crucial support near $2,400–$2,500 and crucial resistance near $2,800–$2,900
- A breakout below the downtrend line could result in a move toward $3,200, while a breakdown could lead to further losses.
- MACD and RSI indicators show early signs of bullish momentum, but confirmation has to precede any established reversal.
Ethereum (ETH) still moves within an established downtrend channel, maintaining bearish momentum. The token tests an important support level while it encounters resistance from the downtrend line, which could determine its next move over the next two days.
Trendline Resistance and Market Structure
ETH has continued tracking downward, with any attempt to move over it met by rejection. This confirms the bearish setup as sellers continue to be in control of price action. The channel bottom has also acted as support, stopping further price declines. If Ethereum does break out over the trendline, it must happen so with heavy volume, showing an upside change. But until there is proof of this break, downward pressure dominates.
A recent tweet on X from TheCrowtrades noted that Ethereum is close to the bottom line of the channel, pointing toward an upside move. While the projection does not indicate an impending move, the price is being monitored by traders whether it stays supported near the bottom line or crosses over the line of resistance.
Key Support and Resistance Levels
Ethereum’s immediate support lies at $2,400–$2,500. If this support level holds, there is always the chance of a reversal back toward higher areas of resistance. A fall below this support could lead to further declines toward $2,200, or even below.
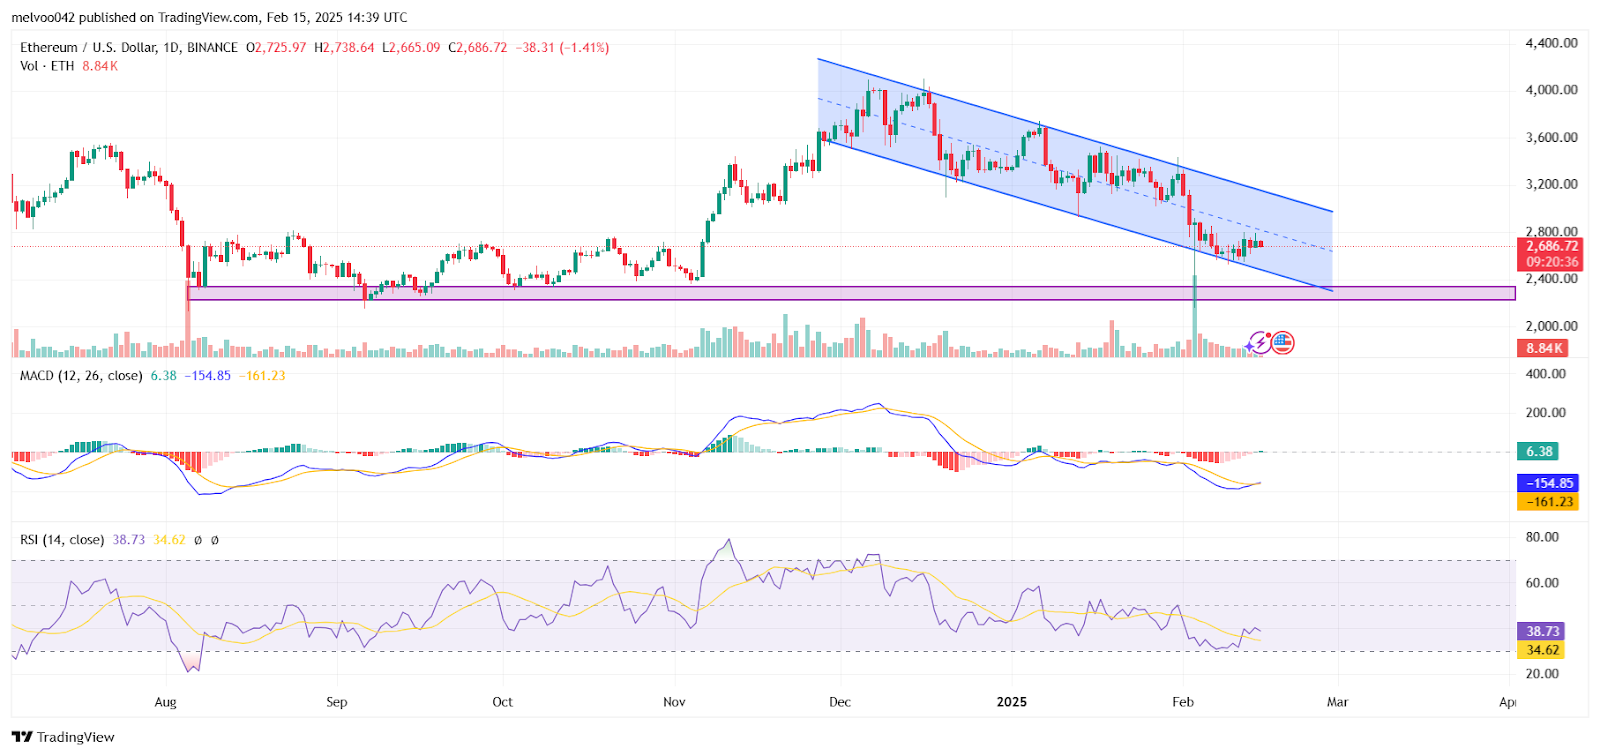
The primary level of support rests close to $2,800–$2,900. A successful break there could pave the way toward $3,200, an essential zone of historical price congestion. Traders are waiting for validation through volume to assess whether the break has legs.
Momentum Indicators and Market Outlook
The Moving Average Convergence Divergence (MACD) shows early indications of bullish momentum, as the signal line moves toward an impending crossover. If this actually occurs, it could signal the change in trend. The Relative Strength Index (RSI) shows 39.54, showing poor bullish strength but not oversold. If RSI crosses over level 50, it could signal new buying momentum.
ETH remains bearish unless there is a break over the trendline. At the time of writing, The price of Ethereum was at $2,709.33, representing an increase by 0.32% over the past 24 hours, while it has increased by 3.91% over the past one week.