
- Ethereum derivatives show +$102M net taker volume, the strongest buy pressure since 2022 after months of selling.
- Previous cycle saw heavy sell pressure at peaks, with net taker volume dropping below -$500M during rallies.
- ETH recovery builds near key resistance levels, with momentum shifting as moving averages approach crossover.
Ethereum is showing a shift in derivatives market behavior as buy-side activity returns after months of heavy selling, according to analyst Darkfost. Data shows net taker volume turned positive in March 2026, reaching +$102 million. This change follows prolonged negative flows during the recent cycle, especially around key price peaks.
Derivatives Data Shows Shift in Momentum
Darkfost noted that Ethereum faced sustained sell pressure throughout the cycle. Net taker volume remained mostly negative across derivatives exchanges. This metric tracks the balance between aggressive buyers and sellers.
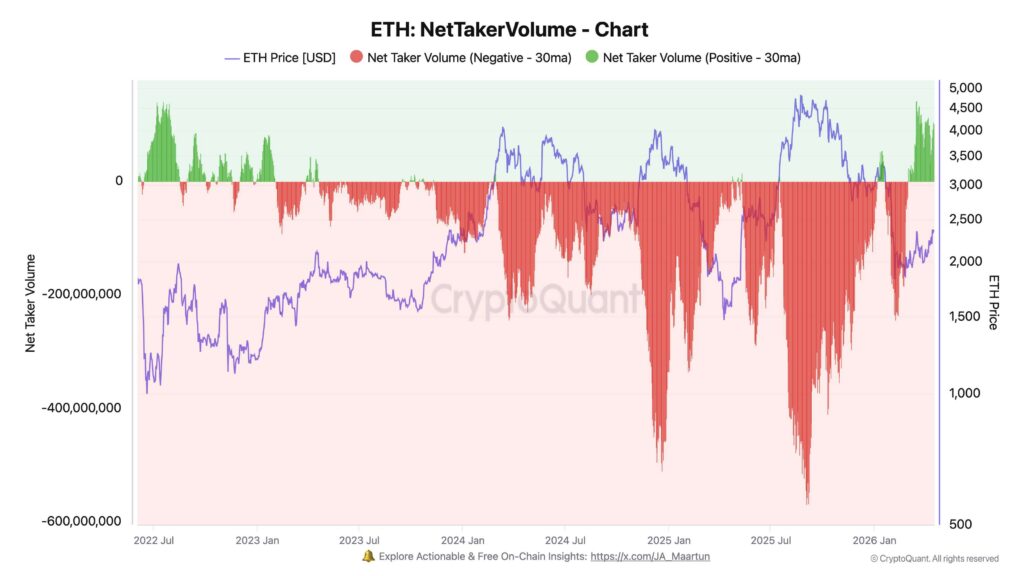
Notably, the imbalance intensified during major price attempts. In December 2024, when ETH pushed above $4,000, net taker volume dropped to -$511 million. Later, near its all-time high below $5,000, the figure declined further to -$568 million.
However, recent data shows a reversal in trend. Since March, buyers have taken control of derivatives flows. The latest reading shows +$102 million in net taker volume. According to Darkfost, this marks the strongest buying pressure since 2022.
Price Action and Earlier Market Stress
While derivatives data shifted, price action had already reflected earlier weakness. Ethereum traded above key moving averages in late October and early November. It peaked near $4,200 to $4,300 during that phase.

However, momentum reversed soon after. ETH broke below both the 50-day and 200-day moving averages. A death cross formed in late November, confirming a broader downtrend.
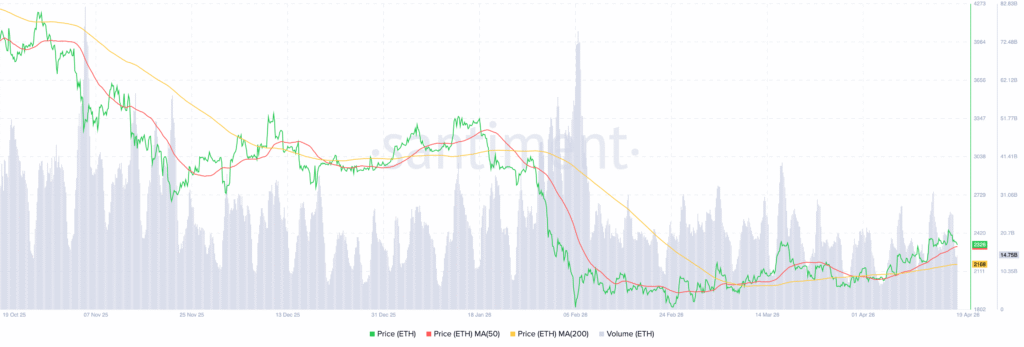
Through December and January, ETH moved between $2,800 and $3,400. It failed to reclaim the 200-day average, which acted as resistance. Then, in early February, a sharp drop pushed price near $1,800.
Recovery Attempts Build into Key Resistance
Following the February decline, the market began to stabilize. ETH formed a base and started a gradual recovery into March and April. Prices climbed back toward the $2,300 to $2,400 range.
Meanwhile, the 50-day moving average turned upward. It now approaches the 200-day average, indicating a potential crossover. This setup places focus on key price levels.
Support currently is between $1,800 and $2,000. Meanwhile, resistance stands near $2,400 in the short term. A higher resistance zone appears above $2,700, based on recent structure.