
- Ethereum is holding support at a notable moving average, which in the past governed market directions as well as signaled bullish or bearish periods.
- Ethereum requires both $3,120 and $2,700 to confirm a price increase as analysts have designated these values as key performance areas.
- Technical indicators reveal that Ethereum currently remains in an undersold state which might encourage price growth in the future.
Ethereum’s price movement is under the spotlight as it lingers close to a significant level of a moving average, indicating the market is poised for a change. Analysts indicate maintaining the level can continue the bullish run despite the recent security issue in the cryptosphere.
Moving Average as a Key Indicator
A recent report from Titan of Crypto highlighted the relevance of this level, with the analyst affirming that as long as Ethereum is higher than the moving average, the bull market is active. It also highlighted the resilience of Ethereum despite the recent Bybit exchange hack.
The blue moving average is a dynamic support level as well as resistance level, generally signalling reversals of the trend when violated. Ethereum has been under the control of multi-year cycles, ranging from bull market to bear market as per this moving average.
Current Market Position and Key Price Levels
Ethereum was ranging around the moving average at the time of writing, indicating the risk of breakdown or a breakout. It has formed the pattern of the higher highs and higher lows of the ascending broadening wedge.
Support levels:
$2,600 – $2,700: In close support as Ethereum is attempting to bounce.
$2,194: Bollinger support level, the second level of support in the case of breakdown.
Resistance levels:
$3,120: Bollinger Band midpoint and SMA 20, the nearest resistance level Ethereum needs to reclaim.
$4,046: Upper Bollinger Band, the point of significant resistance for more bullish movement.
$4,500 – $5,000: Resistance at the top of the wedge, the level targeted upon a bullish break.
Technical Indicators and Possible Scenarios
Bollinger Bands analysis shows Ethereum rebounding off the support level at $2,194, signaling oversold conditions. The dynamic resistance is the $3,120 level, which bulls need to take back for the reversal to be bullish.
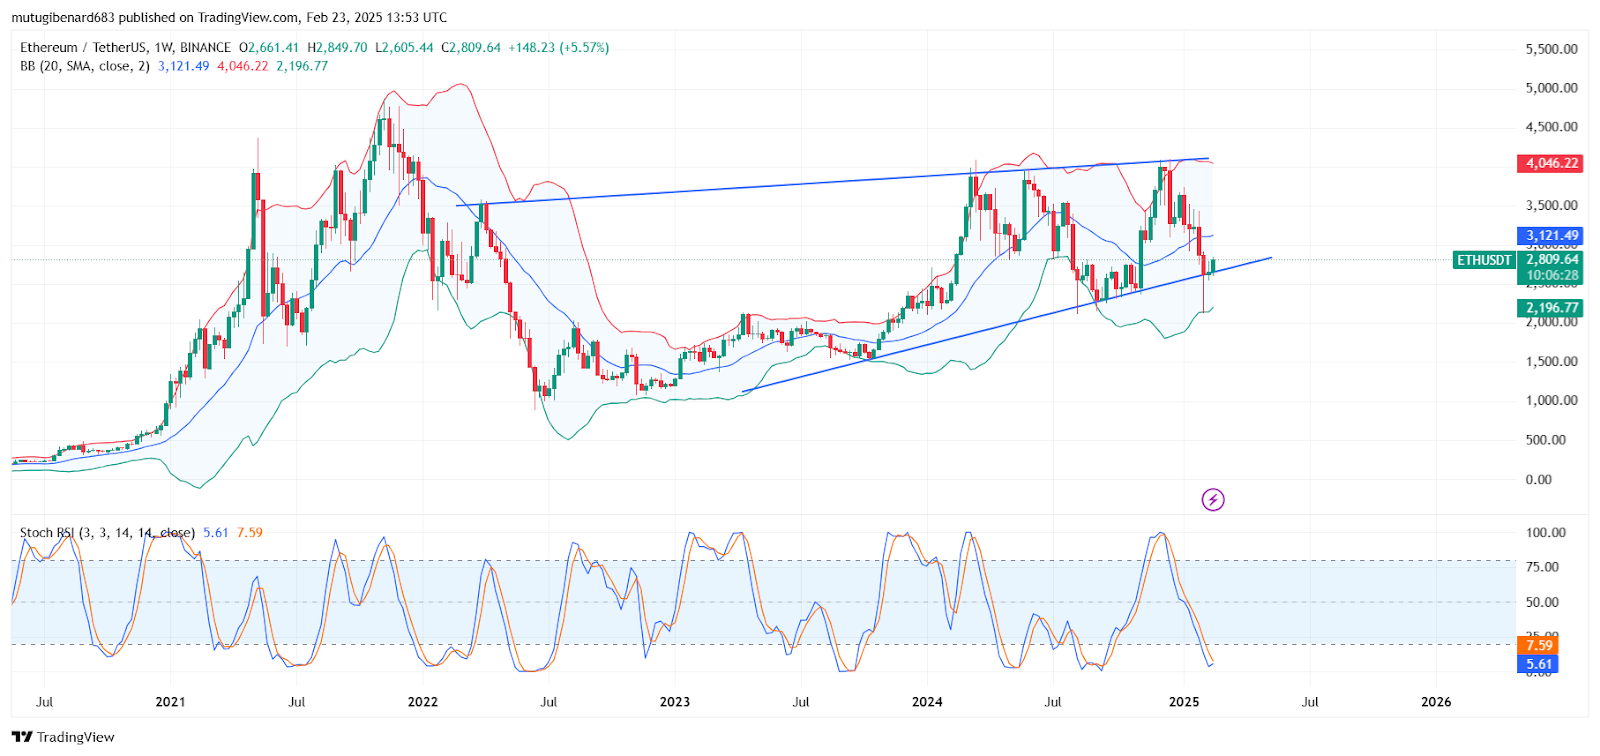
Stochastic RSI is highly oversold at 5.11 as well as 7.43 levels, indicating reversal situations. A bullish cross would confirm the uptrend.
Possible scenarios
If Ethereum maintains its position above $2,700 it might reach $4,000 – $4,500 after breaking through $3,120.
A price failure at $3,120 may drive Ethereum value below $2,600 until it reaches $2,200 – $2,000.
At press time, Ethereum was priced at 2789.13.