
- Ethereum nears $3,500 breakout after multi-year triangle formation since early 2021.
- Long-term technical target sits at $12,000, supported by triangle and Fibonacci projections.
- ETF inflows and declining exchange supply suggest growing institutional confidence in ETH.
Ethereum (ETH) continues to trade within a multi-year symmetrical triangle pattern that began forming in early 2021. Price action has shown steady compression between lower highs and higher lows. A confirmed monthly close above the $3,500 level would signal a breakout, potentially triggering a long-term move toward $12,000.

Triangle Structure Indicates Key Resistance Near $3,500
According to analysis prepared by Captain Faibik, Ethereum’s current monthly chart reflects a symmetrical triangle that has been in formation since early 2021. This pattern shows consistent higher lows while facing strong resistance near the $4,000 level. The triangle’s structure has narrowed considerably, and ETH is approaching the upper trendline.
A monthly close above $3,500 would confirm a breakout from the triangle, indicating the end of a long consolidation phase. Ethereum is trading near $2,957.85, which is 18.97% higher for the month. Analysts are closely watching the July 2025 candle to determine if momentum is strong enough to break past resistance.
The $3,500 level has acted as a ceiling for over three years, with several rejection points since 2021. If broken, it could open the path for Ethereum to move into a price discovery phase. This would align with the broader multi-year uptrend from the 2022 lows.
Long-Term Targets Suggest Potential Move to $12,000
According to an observation by Alex Clay, Ethereum has broken out of a long-term descending broadening wedge. The breakout, confirmed on the weekly chart, supports a bullish trend continuation. Ethereum also formed a golden cross on the daily chart, strengthening the bullish case.
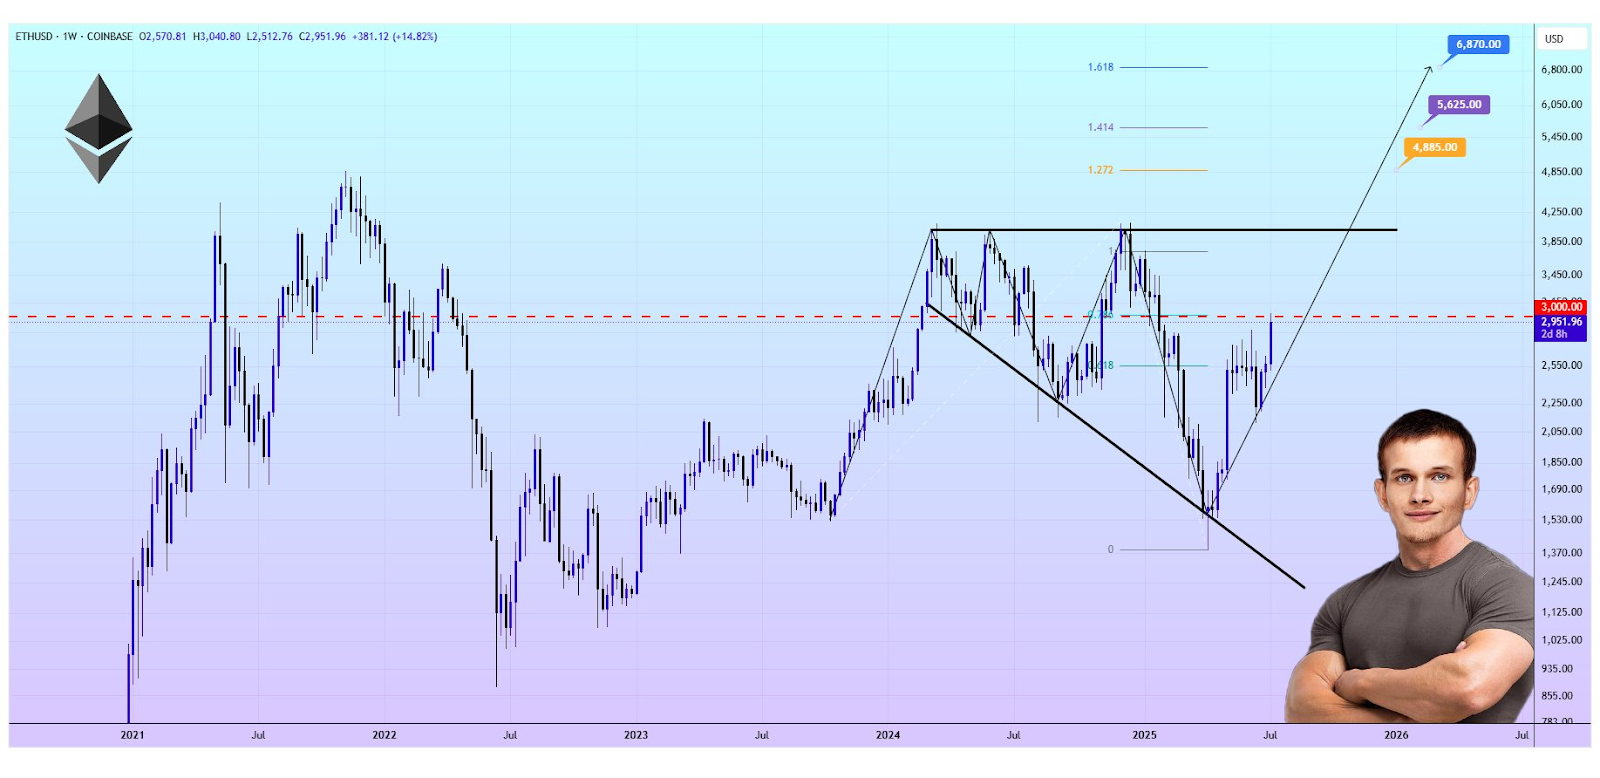
Clay used Fibonacci extension levels to project future price targets. These include $4,885, $5,625, and $6,870. The long-term measured move based on the triangle’s height places the final target near $12,000. Ethereum ETFs have seen inflows exceeding $5 billion, further supporting the current price trend.
Data from on-chain sources also shows that ETH supply on exchanges has dropped, while large holders continue to accumulate. This signals confidence in Ethereum’s long-term potential, especially as the broader crypto market gains strength.