
- Ali noted that Ethena’s weekly chart displayed a red ‘9’ candle and a long lower wick, suggesting buyer efforts amid bearish pressure.
- Technical analysis shows clear support levels around $0.33-$0.38, while TD Sequential robustly indicates a potential rebound and consolidation near $0.50-$0.58 resistance soon.
- Stochastic RSI remains extremely oversold with values near zero, while DMI suggests overall trend strength, prompting close monitoring of price movements today.
Market participants are watching Ethena ($ENA) closely as technical indicators hint at a possible short-term rebound amid a sustained downtrend. Recent charts show key reversal signals and support levels that may prompt buyer interest.
Technical Analysis Overview
A tweet from Ali @ali_charts noted that the TD Sequential indicator flashed a buy signal on the weekly chart. The tweet mentioned strong black candles that signified a bearish trend. The latest candle showed a long lower wick. This detail suggests buyers attempted to reverse the downtrend. The red ‘9’ candle may indicate a pause or potential rebound.
Chart patterns reveal that red candles have dominated the weekly view. Buyers show interest when long lower wicks appear. This pattern draws attention to potential short-term recovery. The indicator also signals caution as consistent bearish momentum remains evident.
Market Support and Resistance
At the time of writing, Ethena was priced at $0.4011. A blue horizontal line marks key support at $0.3529 on the chart. This level appears to serve as a temporary base for price stabilization. Traders monitor these points to assess market strength.
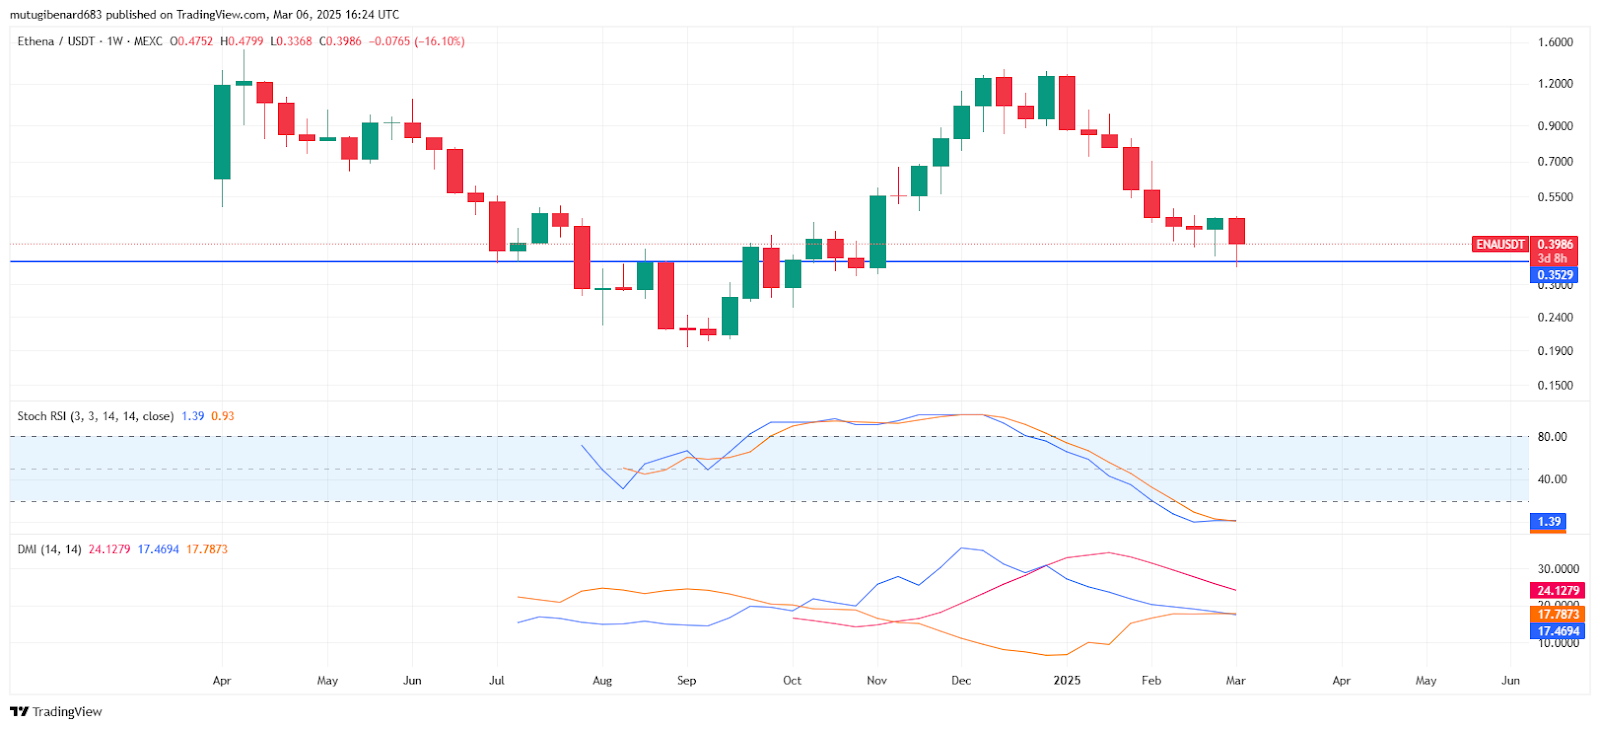
If support holds, the asset could rebound toward resistance at $0.50-$0.58. Breaking support may push the price lower to $0.25 or below. Technical charts show that support levels hold strategic importance.
Momentum Indicators and Trading Outlook
The Stochastic RSI displays readings of 1.39 and 0.93. Both values show that the asset is extremely oversold. The Directional Movement Index confirms a strong trend. ADX stands at 24.1279 while DI+ and DI- indicate a slight bearish bias. Traders may see a rebound if DI+ crosses DI- and volume increases. The chart shows clear bearish momentum, but a short-term bottom is possible.
The momentum indicators provide further context on market behavior. Traders observe oversold conditions for possible relief rallies. The combination of indicators offers insight into price dynamics. Analysis of these factors supports technical decision-making. Technical charts remain a reliable tool for tracking market conditions and guiding trading strategies.