
- Ethereum’s price aligns with a multi-year ascending trendline, testing support levels that previously triggered strong bullish moves in 2019 and 2020.
- The 2-year moving average buy signal has appeared for the first time since 2022, indicating a potential trend reversal in ETH’s price action.
- Ethereum’s RSI is nearing historical oversold levels, suggesting weakness exhaustion that previously led to strong recoveries in past market cycles.
Ethereum appears to be testing a crucial support level as technical indicators suggest a potential macro bottom. Data shows ETH entering a historical buy zone, triggered by a 2-year moving average indicator for the first time since 2022, marking an important moment.
Technical Indicator Insights
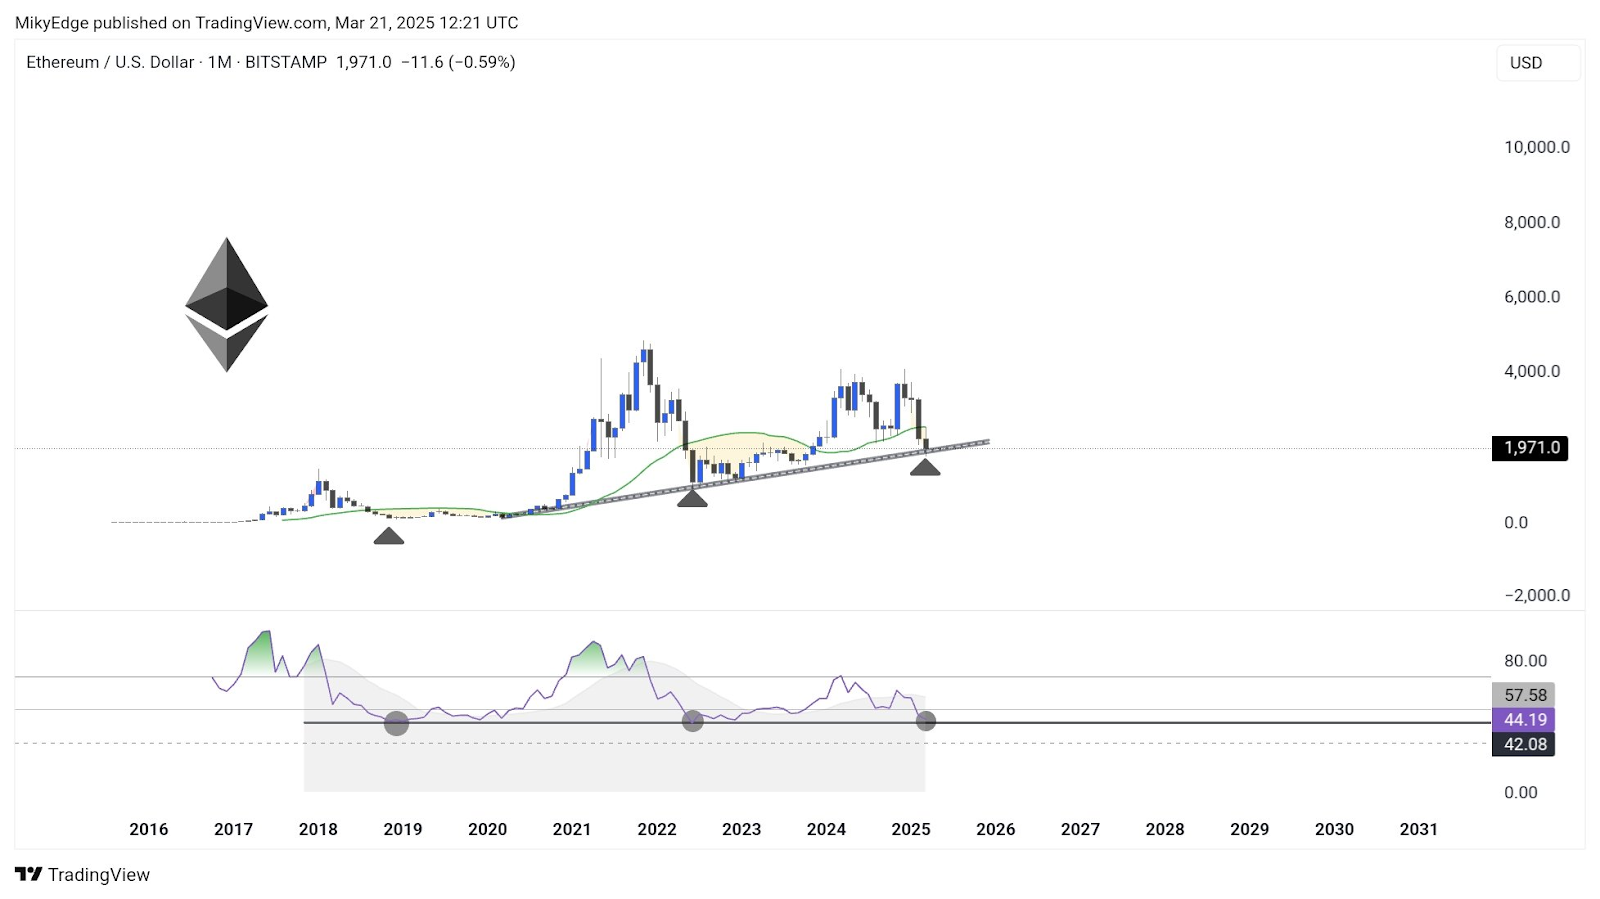
Mikybull Crypto noted on X that ETH has reached a historical buy zone that triggers a macro bottom. The tweet mentioned that the 2-year moving average indicator has just issued a buy signal, which experts find noteworthy. ETH traded at $1,971 at the time of writing, reflecting a slight 0.59% decline over the month. This signal arrives after a period of careful observation by market professionals.
The chart shows three major support touchpoints, marked by black triangles, which align with a long-term ascending trendline. These support levels have been pivotal in previous price recoveries. Historical bounces in 2019 and 2020 led to upward moves in 2021 and 2023. The current test of support may trigger another rebound if the trendline holds firm.
Price Action and Trend Analysis
ETH’s previous peak above $4,800 was followed by a corrective phase that brought the price lower. The present structure suggests that ETH remains in a macro uptrend as it has not broken below the trendline. The moving averages, shown by green and black lines, represent long-term price equilibrium. A temporary dip below these averages signals a period of weakness, yet the overall trend remains intact.
An upward bounce along the ascending trendline might lead to price growth that would reach the first $2,500 resistance and then aim for $3,200. For continued evidence of an upward trend the support levels must remain stable. Investors watch these levels closely for signs of a sustained recovery.
Market Momentum and RSI Analysis
The Relative Strength Index (RSI) currently stands at 44.19, approaching the 42.08 level that marked previous bottoms in 2019 and 2023. This reading falls within an area that has often signaled oversold conditions. A recovery in RSI could indicate that the current weakness is ending.
Should ETH hold its support, buyers may step in and sustain the upward trend. Conversely, a breakdown below key levels could invite further downside risk. ETH now stands at a pivotal juncture that may determine its macro trajectory for the remainder of 2025.