
- Ethereum dipped near $1,500–$1,800, forming a possible bear trap before rebounding toward major resistance at $4,300.
- In 2017, ETH surged 5,000% after breaking $17; analysts compare today’s $3,500–$4,300 zone to that historic setup.
- A confirmed breakout above $4,300 could start Ethereum’s next expansion phase, with projections pointing to $10,000–$15,000.
Ethereum is showing similarities between its current range and the 2016–2017 cycle. According to market analyst Merlijn The Trader, Ethereum’s recent dip near $1,500–$1,800 may represent a classic bear trap, resembling the sharp decline below $8.50 seen in 2016.
That earlier drop preceded a reversal and parabolic rally that carried prices from under $20 to above $300 in only months. The current setup shows Ethereum consolidating below $4,300, with analysts pointing to a potential breakout that could similar the earlier expansion phase.
Historical Comparison Between Market Cycles
Ethereum’s 2016–2017 performance is the comparison. During that period, the asset repeatedly tested resistance between $13 and $17, creating a range that lasted months.
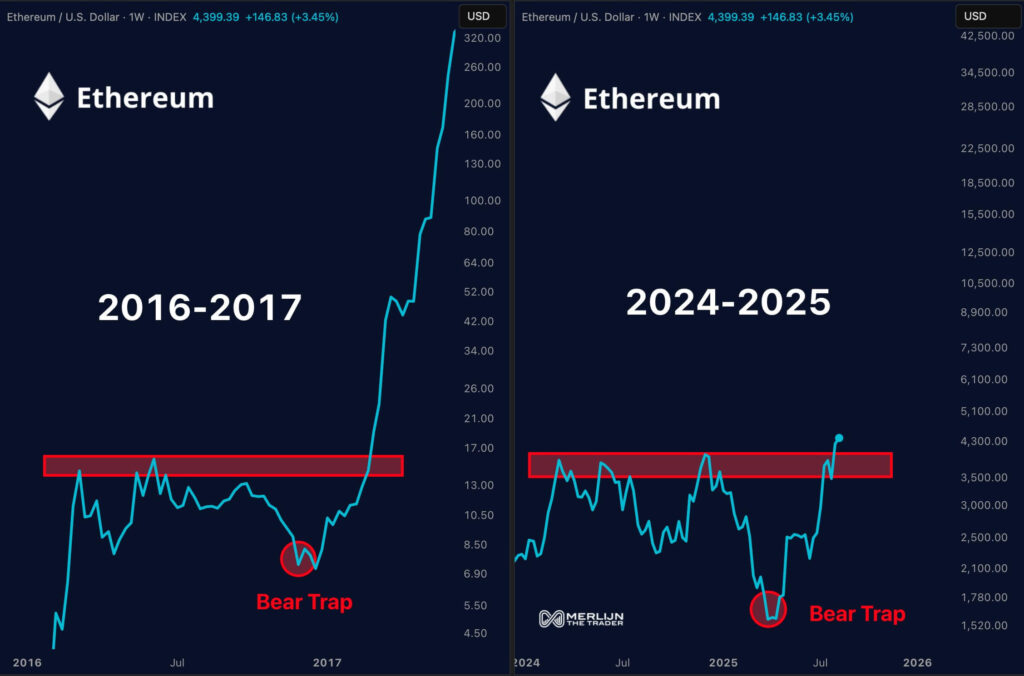
However, the breakdown under $8.50 turned out to be short lived, and price reversed almost immediately. Once resistance finally gave way, Ethereum surged over 5,000%, entering its first major bull cycle.
The 2024–2025 chart now displays similar technical formations. ETH has faced multiple rejections around the $3,500–$4,300 region, creating an extended consolidation zone. The recent retracement to the $1,500–$1,800 range could represent the modern counterpart of the earlier bear trap, with ETH rebounding back toward key resistance.

Current Technical Structure in 2024–2025
The recovery from the $1,500–$1,800 level has renewed market focus on the upper resistance near $4,300. According to Merlijn The Trader, this price zone now functions as the major barrier between consolidation and expansion.
A decisive weekly close above $4,300 would confirm a breakout, strengthening the bullish case for Ethereum’s next rally. Analysts add that the present setup features institutional involvement, exchange traded funds, and wider market liquidity, which were absent in 2017.
These factors could amplify any breakout once price secures support above the resistance range. However, failure to maintain momentum over $3,500 could delay any expansion and extend consolidation further.
Possible Targets if Breakout Confirms
If the structural comparison holds, Ethereum could follow Fibonacci projections targeting between $10,000 and $15,000 in the next cycle. These levels would represent a continuation of the long term growth path observed during earlier phases. Importantly, the current outlook suggests that the bear trap may have already formed, reducing immediate downside risks.
Analysts emphasize that Ethereum ability to clear the $4,300 zone will remain the primary factor influencing the next move. If that condition is met, the projected breakout would align Ethereum path with its historical expansion cycle.