- The technical analysis identifies Fibonacci retracement levels and extensions, demonstrating how past accumulation zones and rising channels inform Dogecoin’s future price trajectory.
- Long-term channel dynamics reveal Dogecoin’s consistent support, with a rising trend since 2015 and historical price behaviors effectively guiding current market stability.
- Current trading near $0.16739 indicates Dogecoin is testing mid-channel support, potentially setting the stage for upward moves toward higher Fibonacci targets strongly.
On March 12, 2025, experts examined Dogecoin’s long-term price performance using logarithmic charts and technical analysis. The review focused on support levels, Fibonacci tools, and channel dynamics over the years.
Long-Term Channel Dynamics
A recent tweet by a prominent crypto analyst on X, Ali Martinez, indicated that Dogecoin is holding a key support level within its channel. The sentiment expressed was based on long-term technical trends and channel behavior. This perspective fits within the broader analysis of historical price movements.
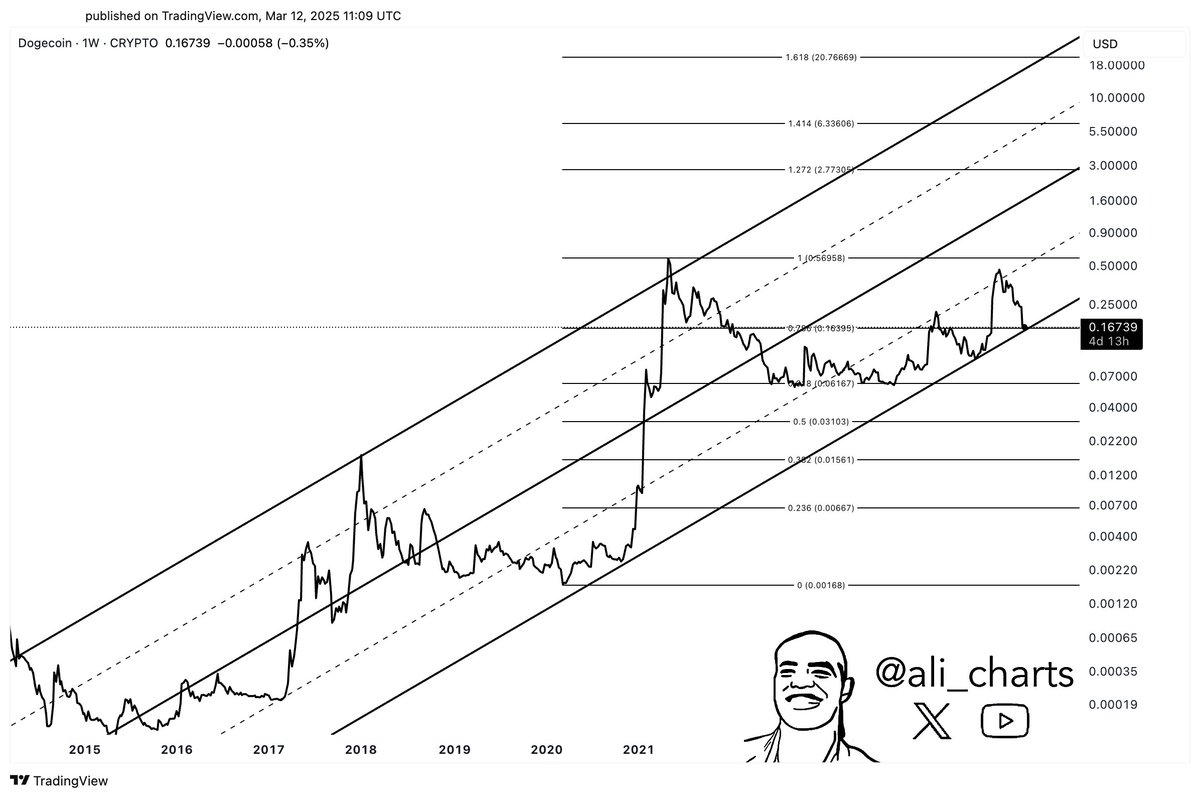
Dogecoin has maintained a rising channel since 2015. The lower boundary has consistently served as a reliable support area, reinforcing price stability. The upper boundary of the channel has historically aligned with peak market rallies. Analysts note that historical bull and bear cycles have seen strong rallies within this channel, followed by moderate corrections.
Fibonacci Analysis and Support Levels
Fibonacci retracement levels mark significant accumulation zones. The 0.236, 0.382, and 0.5 levels have been essential in defining support and resistance over time. Technical charts show that these levels were active before previous periods of price surges. In addition, higher Fibonacci extension levels at 1.272, 1.414, and 1.618 suggest potential targets if upward momentum resumes.
According to the analysis, the 1.0 Fibonacci level marks the previous all-time high of Dogecoin at approximately $1.05. This level is viewed as a critical resistance area for potential future price movements. The structure provided by Fibonacci tools aids in understanding the market’s reaction to historical support and resistance zones.
Market Update and Future Outlook
At press time, Dogecoin trades near $0.1717, close to a mid-channel support level. Price stability at this level may lead to a retest of higher zones, such as the $0.25 area. A break below these levels may trigger a return to lower Fibonacci retracement areas between $0.03 and $0.06.
Technical analysis presents clear scenarios for Dogecoin’s future. One view supports the possibility of a gradual price recovery with targets near $0.50 and $1.00. An alternative view suggests a potential pullback if current support levels fail to hold. This report presents a balanced perspective that aligns with Dogecoin’s historical price performance.